

The best record of MLB's 162-game era is the 2001 Seattle Mariners' 116-46 mark, a .716 winning percentage. At the other end, the 2024 Chicago White Sox went 41-121, setting the modern-era record for losses and the worst record by a club that actually completed all 162 decisions. One important footnote keeps the answer from being quite that simple: the expansion 1962 New York Mets finished 40-120, with one tie, and their .250 winning percentage is lower than Chicago's .253.
This guide separates those measures instead of forcing three different records into one label. It compares completed seasons played under the 162-game schedule, which the American League adopted in 1961 and the National League adopted in 1962. It also explains when an older record is useful context and why a great regular-season total does not automatically produce a championship.
The cutoff for the historical lists is September 3, 2026. The 2026 regular season is still in progress and is scheduled to end September 27, so no 2026 club has a final record yet. Fans tracking that unfinished race should use the 2026 projected standings; this article keeps live results out of a completed-season leaderboard.
What are the best and worst MLB records in the 162-game era?
There is one clear record at the top and two defensible answers at the bottom. Seattle owns the best 162-game-era record by both wins and winning percentage in a completed full season. Chicago owns the most losses and the worst result among teams with exactly 162 decisions. New York owns the slightly lower winning percentage because two scheduled games did not become decisions.
| Question | Team and season | Record | Winning percentage |
|---|---|---|---|
| Most wins in the 162-game era | 2001 Seattle Mariners | 116-46 | .716 |
| Most losses in the modern era | 2024 Chicago White Sox | 41-121 | .253 |
| Lowest winning percentage in the 162-game era | 1962 New York Mets | 40-120, plus one tie | .250 |
The phrase 162-game era refers to the schedule format, not a promise that every team's W and L columns will add to exactly 162. The American League expanded and adopted the longer schedule in 1961; the National League followed in 1962. Rainouts that were not made up, ties that did not count in the standings, strikes and other interruptions can change the number of decisions.
That boundary also excludes tempting but misleading comparisons. The 1906 Chicago Cubs won 116 games and posted a superior .763 percentage, but they played a 152-game schedule. The 1899 Cleveland Spiders were far worse than any modern club, but their season belonged to a radically different league and schedule. Both matter to baseball history; neither is the clean answer to a question specifically about the 162-game era.
When someone asks for the “best record,” wins and winning percentage point to the same Seattle club. When someone asks for the “worst record,” state the metric. Chicago is the losses answer; the 1962 Mets are the percentage answer. That one sentence resolves most contradictory-looking search results.
The 2001 Mariners set the 162-game-era standard
Seattle did more than reach 116 wins. Its 116-46 record put the club 70 games over .500, produced a .716 winning percentage and won the AL West by 14 games over an Oakland team that itself won 102. No team in the 162-game era has won more or posted a better percentage across a completed, non-shortened season.
The performance was remarkably balanced. The Mariners scored 927 runs and allowed 627, a plus-300 run differential. They led the American League with a .288 team batting average and a 3.54 ERA, while their .986 fielding percentage also led the league. That is why reducing the season to one hot streak misses the point: Seattle sustained elite hitting, run prevention and defense for six months.
Ichiro Suzuki supplied the defining individual story. In his first MLB season, he hit .350, collected 242 hits and stole 56 bases, then won both the AL Rookie of the Year and Most Valuable Player awards. Bret Boone hit .331 with 37 home runs and a league-leading 141 RBIs. Jamie Moyer won 20 games, and a deep roster kept producing after the recent departures of Ken Griffey Jr. and Alex Rodriguez.
The path to 116 was not a mathematical curiosity created by an extra game. Seattle reached the standard in its 161st contest, then lost the finale to finish 116-46. The club thereby matched the 1906 Cubs' win total while playing the ten additional games built into the later schedule. Chicago's .763 percentage remains higher across its 152-game season, but Seattle owns the clean benchmark for the 162-game format.
October supplies the essential qualifier. The Mariners needed five games to beat Cleveland in the Division Series and then lost the AL Championship Series to the Yankees, four games to one. They never won the pennant. Calling Seattle the best regular-season record is precise; calling it the most successful overall season would require a different test, one that includes the championship.
The 2024 White Sox set the modern loss record
The 2024 Chicago White Sox became the first modern-era MLB team to lose 121 games. Their final 41-121 record added to exactly 162 decisions, making it the worst full-schedule result by loss total. The previous post-1900 high was 120, set by the 1962 Mets.
Loss No. 121 arrived September 27 in Detroit, where the Tigers won 4-1 and clinched a postseason berth. Chicago then won its final two games, including the season finale, to reach 41 victories. Those late wins mattered to the percentage comparison, but they could not erase the new loss record.
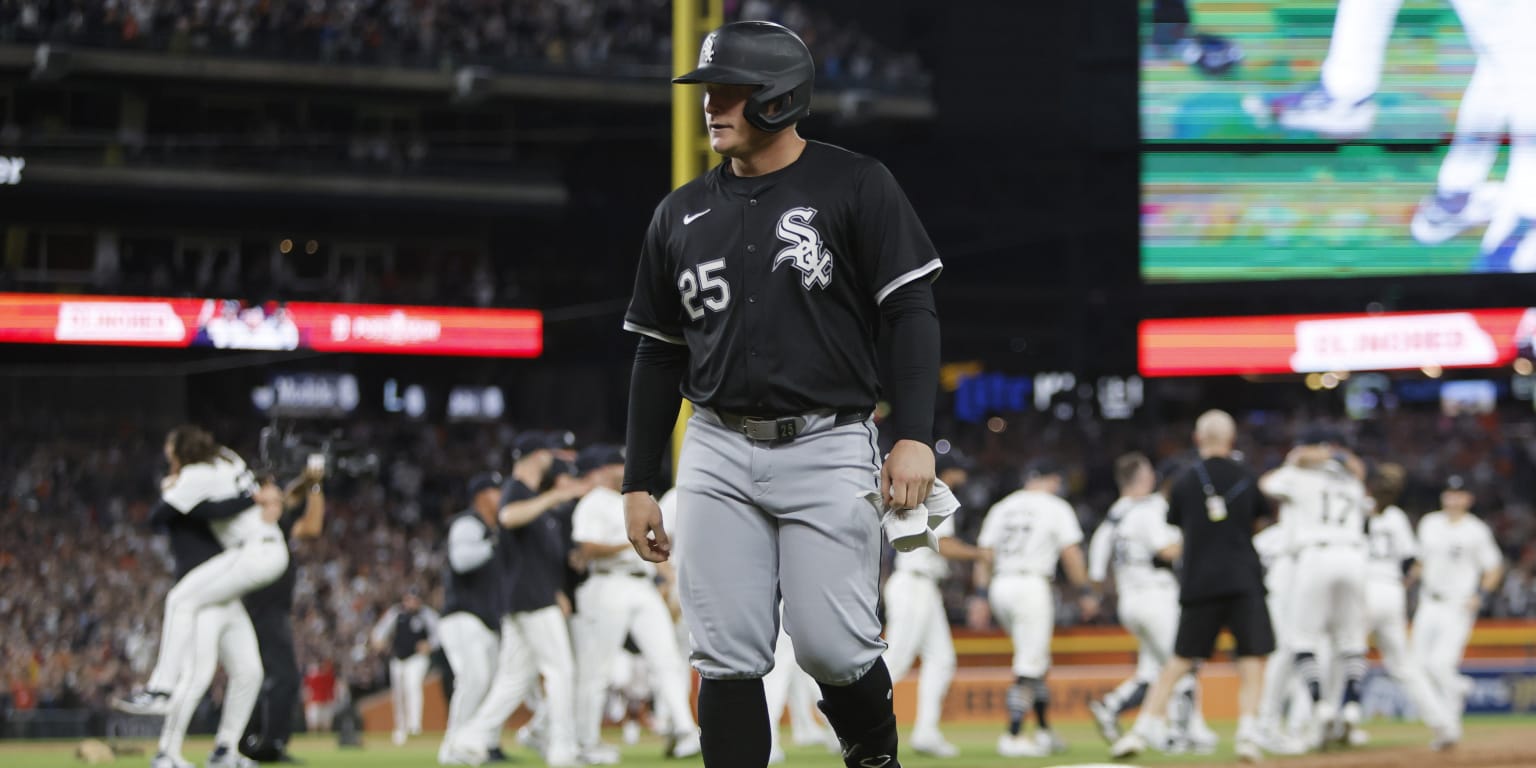
The record was the product of problems across the whole season. Chicago scored 507 runs while allowing 813, a run differential of minus 306. The club went 23-58 at home and 18-63 on the road, finishing 51.5 games out of first in the AL Central. A 21-game summer losing streak tied the American League record and came within two games of the modern-era MLB mark.
Run differential also adds useful context without changing the official record. The expanded MLB standings assigned Chicago a 48-114 expected record based on runs scored and allowed, seven wins better than its actual result. That does not make 121 losses accidental; it means the timing and distribution of runs made an already poor performance even more damaging in the W-L column. Our guide to expected win-loss records explains how to read that comparison.
The safest wording is therefore specific: the White Sox own the most losses in a modern MLB season and the worst record among clubs with 162 wins-and-losses decisions. “Lowest percentage ever” is a different claim. That distinction is not an attempt to soften the season; it is what keeps the historical answer mathematically correct.
Why the 1962 Mets still own the lower winning percentage
The National League's first 162-game schedule was also the New York Mets' expansion season. New York finished 40-120 in the standings, with one additional tie, for a .250 winning percentage. The club played 161 games but recorded only 160 decisions because the tie did not enter either the win or loss column.
That detail explains the apparent contradiction with the 2024 White Sox. MLB calculates team winning percentage as wins divided by wins plus losses. For the Mets, the calculation is 40 divided by 160, exactly .250. For Chicago, it is 41 divided by 162, or .253 when rounded to three decimals. Therefore, the Mets won a smaller share of their decided games even though the White Sox accumulated one more loss.
New York's broader numbers support the severity of the record. The Mets scored 617 runs and allowed 948, producing a minus-331 differential. They went 22-58 at the Polo Grounds, 18-62 on the road and finished 60.5 games behind the National League champion San Francisco Giants. The last-place result was not created by a single disastrous month.
Yet the label still needs its boundary. The Mets do not own the lowest percentage in all major-league history. Several older clubs playing very different schedules finished lower, including the 1899 Cleveland Spiders. The meaningful claim is that New York has the lowest regular-season winning percentage among teams playing in the 162-game schedule era.
This is also why projecting the Mets to a theoretical 162 games is unnecessary. Their official .250 already describes what happened in the games that produced decisions. Adding imaginary wins or losses would create a fictional record. For an exact-history comparison, retain all three pieces—40 wins, 120 losses and one tie—and use the official percentage.
Best MLB records since the 162-game schedule began
Only five completed team seasons in the 162-game era have reached 109 wins. Sorting by victories keeps the table aligned with the most common version of the search, while the percentage and October columns show what the raw total cannot.
| Rank | Team | Record | PCT | Postseason result |
|---|---|---|---|---|
| 1 | 2001 Seattle Mariners | 116-46 | .716 | Lost ALCS |
| 2 | 1998 New York Yankees | 114-48 | .704 | Won World Series |
| 3 | 2022 Los Angeles Dodgers | 111-51 | .685 | Lost NLDS |
| T-4 | 1961 New York Yankees | 109-53, plus one tie | .673 | Won World Series |
| T-4 | 1969 Baltimore Orioles | 109-53 | .673 | Lost World Series |
The gap at the top is larger than it first appears. The 1998 Yankees won 114, two short of Seattle, and no later club has passed New York either. The 2022 Dodgers came closest in this century with 111 victories, yet a 3-1 Division Series loss to San Diego ended their postseason almost immediately.
The 1961 Yankees entry carries a tie because that game counted as a game played but not in the W-L percentage. Their 109 wins and 53 losses still produce 162 decisions and a .673 percentage. The Yankees then beat Cincinnati in the World Series. Eight years later, Baltimore posted the same 109-53 record but lost the World Series to the 100-win “Miracle Mets.”
A shortened season should not be silently inserted into this table. The 2020 Dodgers went 43-17 for a .717 percentage, one point above Seattle after rounding, but MLB played only a 60-game regular season. That was a great championship season; it was not evidence that Los Angeles sustained a better record across 162 games.
These are historical, objective results. A weekly list such as the 2026 MLB power rankings answers a different question by weighing current form, injuries and team quality. A club can rank first today without being on pace for this all-time table—and an early pace is not a final record.
Worst MLB records of the 162-game era
Sorting the bottom of the era by winning percentage places the 1962 Mets just below the 2024 White Sox. The next tier now includes the 2025 Colorado Rockies, whose completed season must be included in a list checked through September 2026.
| Rank by lowest PCT | Team | Record | PCT | Schedule note |
|---|---|---|---|---|
| 1 | 1962 New York Mets | 40-120, plus one tie | .250 | 161 games; 160 decisions |
| 2 | 2024 Chicago White Sox | 41-121 | .253 | 162 decisions; loss record |
| T-3 | 2003 Detroit Tigers | 43-119 | .265 | 162 decisions |
| T-3 | 2025 Colorado Rockies | 43-119 | .265 | 162 decisions |
| 5 | 2018 Baltimore Orioles | 47-115 | .290 | 162 decisions |
| 6 | 2019 Detroit Tigers | 47-114 | .292 | 161 decisions |
Colorado's 2025 finish is a useful test of how records should be described. The Rockies tied the 2003 Tigers at 43-119 and .265, but they did not pass Chicago's 121 losses or New York's .250 percentage. For much of the season, a record pace may have looked possible; the completed total is the only figure that belongs in this historical table.
Detroit appears twice, sixteen years apart. The 2003 club was two wins better than the 2024 White Sox and three wins better than the 1962 Mets, while its 119 losses stood as the American League record until Chicago passed it. The 2019 Tigers played only 161 decisions, which is why their 47-114 mark produces a slightly higher .292 percentage than Baltimore's 47-115 in 2018.
None of these numbers should be converted to a 162-game “pace” after the fact. A pace is useful during a season, but the official record preserves rainouts, ties and every game that actually counted. For current results rather than completed history, use the complete MLB schedule and the live standings it supports.
Why a historic regular-season record does not guarantee a title
A 162-game record measures sustained performance better than a short series can. It samples six months of lineup changes, rotation turns, travel, injuries and opponents. The postseason asks a related but different question: which qualified team can win a small number of series in October?
The two winningest clubs in this era show both possible endings. Seattle won 116 games in 2001 but went 4-6 in October and lost the ALCS. The 1998 Yankees won two fewer regular-season games, then added 11 postseason victories, swept San Diego in the World Series and finished with 125 combined wins. If the category is regular-season record, Seattle ranks first. If the category is a dominant championship season, New York has the stronger complete résumé.
The 2022 Dodgers make the separation even sharper. Los Angeles won 111 games, outscored opponents by 334 runs and finished 22 games ahead of San Diego in the NL West. The Padres nevertheless won their Division Series in four games. Six months of superiority established the Dodgers' historical record; it did not begin the best-of-five series with wins already on the board.
The same lesson predates the Wild Card structure. Baltimore's 109-win club swept Minnesota in the first ALCS in 1969, won Game 1 of the World Series and then lost four straight to the Mets. That result is part of the “Miracle Mets” story, but it does not change the Orioles' 109-53 regular season.
A sound historical comparison therefore uses separate columns for separate achievements. Record and run differential describe the long schedule. Pennants and championships describe October advancement. The World Series winners list supplies the championship record; the tables here deliberately preserve regular-season rank even when the postseason ended early.
How to compare MLB team records correctly
A reliable comparison begins by writing down the exact claim. “Most wins,” “most losses,” “best percentage” and “best champion” are four different questions. Use this sequence before repeating a record:
- Set the era. For this guide, the boundary is the expansion era beginning in 1961, when the AL adopted 162 games; the NL followed in 1962. A pre-1961 club can provide context but should not quietly enter a 162-game-era ranking.
- Use the official W-L calculation. Winning percentage is wins divided by wins plus losses. A tie is a game played, but it is not a decision in that denominator. This is the difference between the 1962 Mets' .250 and the 2024 White Sox's .253.
- Check games played. A scheduled 162-game season can finish with 160, 161, 162 or occasionally more games recorded. Postponements once left games unplayed, ties could add a game without a decision, and historical tiebreaker games could extend a season. Since the 2022 postseason expansion, MLB no longer uses a Game 163 to settle playoff ties.
- Separate final records from pace. A 20-10 club is on a 108-win pace, but it has not won 108 games. Likewise, a projected final standing is not eligible for an all-time table. Strike-shortened and pandemic-shortened seasons should be labeled, not scaled up and presented as results.
- Add context without replacing the record. Run differential equals runs scored minus runs allowed. Pythagorean or x-W/L estimates turn that scoring balance into an expected record. These measures can reveal overperformance or underperformance, but the official standings remain the official result.
The final citation should contain four items: team, season, number and scope. “The 2001 Mariners own the 162-game-era record with 116 wins” is much stronger than “Seattle is the best team ever.” The first can be checked; the second depends on unstated criteria.
That discipline matters most during an active season. Daily standings are factual snapshots, but they remain subject to every unplayed game. Historical leaderboards should change only when a season is complete and the result has been verified.
Best and worst MLB record FAQ
What is the best record in a 162-game MLB season?
The 2001 Seattle Mariners went 116-46, a .716 winning percentage. That is the most wins and highest percentage in a completed 162-game regular season. The 1906 Cubs also won 116, but they did so on a shorter schedule and had the higher .763 percentage.
What team has the most losses in a 162-game season?
The 2024 Chicago White Sox hold the modern-era record with 121 losses. They finished 41-121, with all 162 games producing decisions. Chicago passed the previous loss record of 120 established by the 1962 Mets.
Why are the 1962 Mets sometimes called worse than the 2024 White Sox?
The Mets had the lower winning percentage: .250 versus .253. New York went 40-120 and also played one tie, which did not count in the percentage. Chicago lost one more game but also won one more and completed 162 decisions. “Most losses” belongs to Chicago; “lowest percentage in the 162-game era” belongs to New York.
Has an MLB team ever finished 162-0 or 0-162?
No. The winning extreme is Seattle's 116-46 record, so even the era's best full-season club lost 46 times. The losing extreme among teams that completed 162 decisions is Chicago's 41-121, meaning even that club won 41 games. A perfect or winless 162-game result remains hypothetical.
Can a 2026 team enter these lists?
Yes, but only after its regular season is complete. As of September 3, the 2026 schedule is still active, with the final day set for September 27. A team's current record or 162-game pace can be compared with Seattle, Chicago or New York, but it cannot replace a completed result. Use the MLB games today page for the current slate rather than treating this historical guide as a live scoreboard.
Loading comments...