
There is no single official set of 2026 MLB projected final standings. FanGraphs publishes forward-looking standings and schedule-aware playoff odds, while Baseball Prospectus publishes PECOTA forecasts. Their numbers can differ because they project players, playing time, team strength and remaining games differently.
MLBSchedule.net is not presenting a new proprietary model in this article. Instead, this guide explains the public methods, compares a small number of attributed 2026 examples and shows how to tell a projection from an actual record or an expected-record statistic. It does not reproduce either provider's complete table.
The analysis was prepared August 12, 2026. Actual-record examples run through games completed August 11; preseason examples remain labeled preseason. Because projections change with every result and roster update, use the current MLB standings for what has happened and the named provider's page for its newest forecast. The goal here is durable interpretation: what a projected win total means, how playoff odds are simulated and where uncertainty enters.
What “Projected Final Standings” Actually Means
A projected final record combines two very different types of games. Completed wins and losses are banked facts. The unplayed portion is an estimate based on a model's view of future team strength. If a club is 70-50 and projected to play 23-19 the rest of the way, its point estimate becomes 93-69. Only the first 120 games are certain.
FanGraphs makes the separation visible with columns for year to date, projected rest of season and projected full season. This prevents a common reading error. A 93-win full-season line does not mean the model expects the team to win 93 more games, and a .548 rest-of-season percentage does not overwrite its actual winning percentage.
A point estimate is also not the same as the most likely exact record. In a simulation, a team can finish with many totals. The displayed wins may be the average across those outcomes, rounded into a clean line. The useful question is not “Will it finish exactly 93-69?” but “Where is the center of the forecast, and how wide is the range around it?”
Playoff probability is a third output. Two teams with the same projected win total can have different odds because they play in different divisions, face different remaining schedules or sit on different sides of a crowded cutoff. Likewise, a one-win difference in a tightly packed race can matter more than several wins for a club with a large cushion.
- Actual record: completed results.
- Rest-of-season projection: estimated performance in unplayed games.
- Projected final record: actual results plus estimated remaining results.
- Playoff odds: the share of simulated outcomes that end in qualification.
How FanGraphs Builds Projected Standings and Playoff Odds
FanGraphs offers two related views that should not be treated as interchangeable. Its Projected Standings page estimates neutral-opponent team strength from Depth Charts and explicitly says it does not factor in the remaining schedule. Its Playoff Odds tool starts with current standings, remaining games and projected strength, then estimates the chance of each outcome on the actual schedule.
In the standard FanGraphs projection mode, projected rate statistics are a 50/50 blend of ZiPS and Steamer, paired with FanGraphs Depth Charts playing-time estimates. Those player-level expectations become a team-level probability of beating a .500 opponent on neutral ground. The remaining schedule then turns neutral strength into game probabilities.
FanGraphs simulates the rest of the season 20,000 times. It counts how frequently each team wins a division, takes a Wild Card, advances through playoff rounds or wins the World Series. The projected W-L record is the average final record across those simulated seasons. That is why a projected record and a playoff percentage describe a distribution rather than a single scripted future.
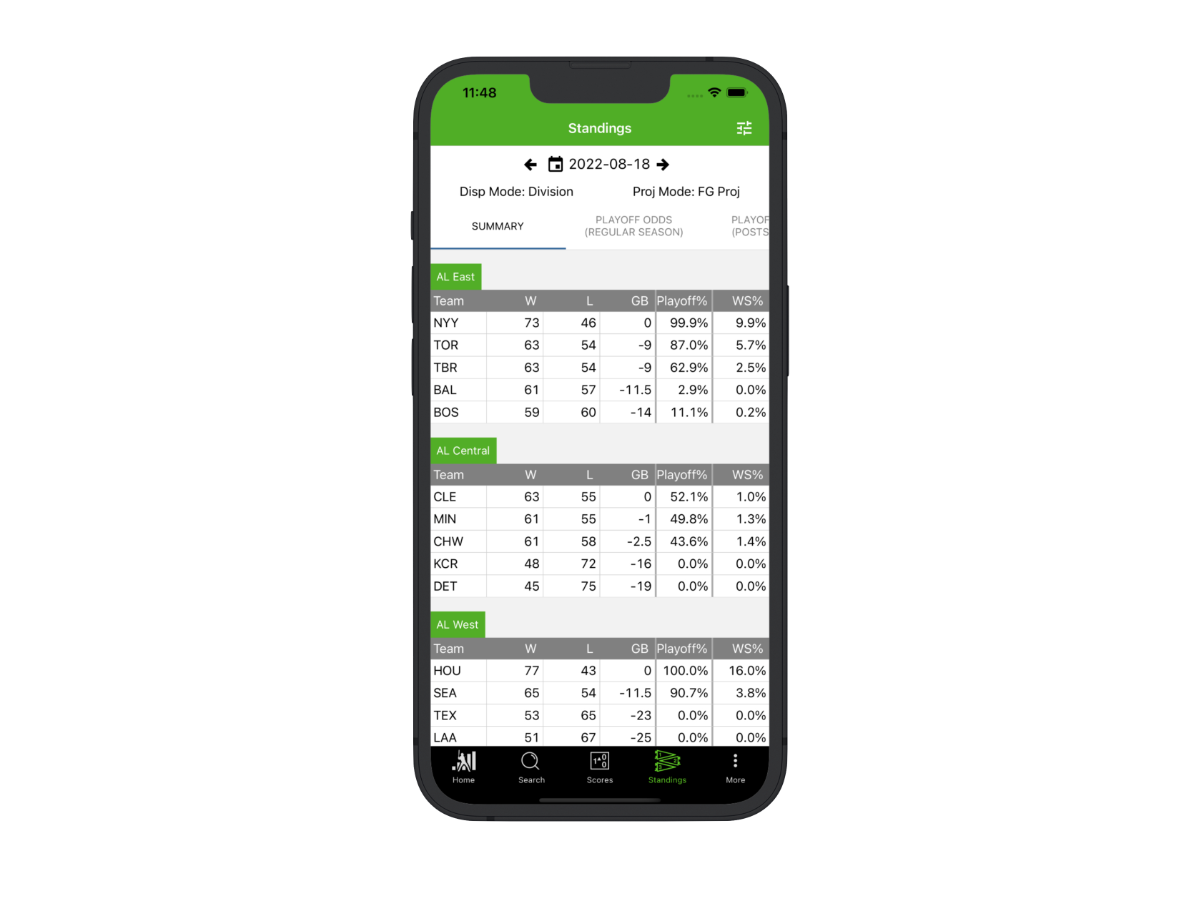
The site also exposes alternative modes. ATC combines multiple projection systems for rate statistics; season-to-date mode looks backward and weights recent games more heavily; coin-flip mode assigns every matchup a 50/50 chance. Changing modes changes the assumed team strengths while leaving the broader simulation framework in place. If two fans cite FanGraphs but selected different modes, their numbers can disagree without either one copying the page incorrectly.
Strength of schedule adds another layer. FanGraphs weights the neutral projected strength of remaining opponents by how often each team will face them. It also cautions against simplistic comparisons between division rivals because their common games include each other. The important practical point is that the schedule-aware odds page answers a richer question than the neutral Projected Standings page.
What PECOTA Adds—and Why Its Numbers Differ
PECOTA is Baseball Prospectus' projection system. Like other serious forecasts, it begins below the team level: expected player performance and playing time feed estimates of team scoring and prevention, which are converted into season outcomes through simulation. Baseball Prospectus owns the system, and its detailed formulas are not fully public, so a responsible comparison should describe attributed outputs without pretending to reconstruct the machinery.
MLB's February 11 review of the 2026 PECOTA release gives a useful example. PECOTA placed the Dodgers at a median 105 wins across thousands of simulated seasons. FanGraphs was around 99. Both systems agreed that Los Angeles was baseball's strongest preseason team, yet their centers differed by six wins. Agreement on direction did not require agreement on degree.
The same comparison exposed larger ordering disputes. PECOTA gave Kansas City a slight edge in the AL Central, while FanGraphs clearly favored Detroit. PECOTA placed Boston fourth in the AL East, whereas FanGraphs put the Red Sox third within a tightly grouped top four. Both liked the Cubs in the NL Central, but PECOTA projected a much larger advantage. PECOTA was also more optimistic about Houston's American League standing.
These differences are a feature of modeling, not evidence that one table was calculated carelessly. Systems can weigh recent seasons, aging curves, comparable players and uncertainty differently. They can assign different playing time to an injured starter, a prospect or a crowded position. They can convert projected runs into wins differently and simulate the schedule with different assumptions.
The date is essential. Those PECOTA-versus-FanGraphs numbers were preseason estimates, before 2026 results supplied new evidence. Comparing them with an August forecast can answer “How much has the outlook changed?” It cannot fairly answer “Which provider currently believes this?” unless both inputs are updated to the same day.
Why X-W/L Is Not a Final-Standings Projection
X-W/L, the expected win-loss column in expanded standings, is often pulled into projection discussions because MLB says Pythagorean winning percentage can help evaluate future outlook. But the displayed record is fundamentally backward-looking. It uses runs scored and allowed in games already completed to estimate the record those totals would ordinarily support.
A forward projection asks a different question. It estimates the players who will take future plate appearances and innings, how well they will perform, and which opponents remain. Schedule-aware playoff odds then simulate those matchups. X-W/L has no direct input for a newly injured starter, a deadline acquisition, a prospect's future playing time or a difficult September trip.
That does not make expected record useless. If a team has 65 actual wins but scoring totals consistent with 59 expected wins, the gap is evidence worth investigating. A model may reasonably temper its future estimate, especially if other performance indicators agree. It should not simply replace 65 banked wins with 59, however, because completed results remain part of every final record.
A shortcut that takes current X-W/L pace and multiplies it to 162 games is a homemade forecast. It can be transparent and educational, but it is not the same product as FanGraphs playoff odds or PECOTA. It ignores opponent order and assumes the same roster and run relationship continue. Our X-W/L explainer covers the formula and interpretation in detail.
Four 2026 Examples That Show Why the Models Diverge
Dodgers: consensus favorite, different ceiling
In February, PECOTA's median for Los Angeles was 105 wins, while FanGraphs was around 99. Both identified the Dodgers as baseball's top team, but PECOTA saw a more extreme outcome. Through August 11, Los Angeles was 71-48 and led the NL West. The broad consensus still looked sensible; the exact finish remained unresolved. This is a case where agreement on rank was more durable than either point total.
AL Central: both preseason orders faced a surprise
PECOTA gave Kansas City a slight preseason edge; FanGraphs favored Detroit. At the August 11 snapshot, the White Sox led at 61-57, Detroit was second at 59-60 and Kansas City was fifth at 49-71. The lesson is not that projection systems have no value. It is that preseason forecasts allocate probability across outcomes, and a contender outside the modal order can become the realized season.
Boston: similar rank, changing postseason leverage
PECOTA placed the Red Sox fourth in the preseason AL East, while FanGraphs placed them third with 58.5% playoff odds. Boston was third at 64-55 through August 11, but the rank alone hides its journey. The club had surged to 4.5 games above the Wild Card cutoff after being outside it at the break. Our post-All-Star standings analysis shows why an in-season update can change probability even when division rank looks familiar.
Houston: model disagreement inside a tight race
PECOTA gave Houston the fourth-best projected winning percentage in the AL at .528; FanGraphs put the Astros seventh at .500. Through August 11, Houston was only 61-60 yet led the AL West by half a game. That result supports neither a simplistic “PECOTA was right” nor “FanGraphs was right.” Team strength and race position are different: a modest record can lead a weak or compressed division.
These examples compare dated, attributed claims. They do not freeze a February opinion as a current forecast. To evaluate what happens next, check the remaining schedule, updated rosters and the provider's newest model run. A forecast can age correctly only if its timestamp travels with it.
How to Read Playoff Odds Without Overstating Certainty
A FanGraphs playoff probability is a frequency inside its simulation framework. A 90% chance means the team qualified in about 18,000 of 20,000 simulated seasons using the selected strength assumptions, current standings and remaining schedule. It does not mean the next game has a 90% win probability, and it does not guarantee qualification.
Displayed extremes need special care. FanGraphs explains that 100.0% can mean at least 19,990 simulated qualifications, rounded upward. A club may still lack an official clinch. Conversely, 0.0% can mean fewer than ten simulated qualifications, not mathematical elimination. Only completed results and MLB's rules create an official clinch or elimination.
Ranges are usually more informative than a lone total. FanGraphs' distribution view includes 25th- and 75th-percentile win totals, revealing whether a point estimate sits inside a narrow band or a wide set of plausible finishes. The distribution naturally tightens as games leave the remaining schedule and become fixed wins or losses.
Odds also answer a structural question. A strong team can have lower division odds than a slightly weaker club facing easier competition, yet retain high Wild Card odds. World Series probability adds multiple postseason rounds and more uncertainty. Before interpreting any percentage, identify whether it refers to division, Wild Card, any playoff berth, a specific round or the championship.
Finally, probability is not seeding. The MLB playoff format determines division-winner placement, Wild Card seeds and first-round byes. A model estimates how often a team lands in those outcomes; it does not redefine the bracket or certify a berth.
What Changes a Projection During the Season
Every completed game changes two parts of a forecast. It banks one result and removes one uncertain matchup. A win can also hurt a rival's path, especially in a head-to-head race. FanGraphs says its playoff odds update shortly after games, so two screenshots taken on consecutive mornings may both be authentic and still show different totals.
Roster information can produce a larger jump than one result. On August 1, Detroit traded Tarik Skubal to the Dodgers. A current system must move his projected innings, change the playing time behind him and reassess both clubs. The final effect depends on how the model values Skubal, his replacements and the players Detroit received; simply transferring past WAR would not reproduce a provider's forecast.
Injuries and returns operate similarly. A player can remain on the roster but receive fewer projected plate appearances or innings. A prospect promotion introduces limited major-league data and a wider uncertainty band. Even without a transaction, changes to a depth chart can alter projected team strength.
The remaining schedule changes as well. Once an easy opponent is completed, it no longer helps future strength of schedule. Rainouts and makeups can alter rest and pitching plans. FanGraphs' overall playoff odds use projected overall roster strength and do not directly account for the scheduled starting pitcher in each future game, whereas its game-specific tools can. Know which level you are reading.
For near-term decisions, pair updated forecasts with the daily MLB matchups and the complete schedule. A model update is not an explanation by itself. Look for the new result, roster information, playing-time estimate or schedule change that plausibly moved the number.
A Practical Workflow for Comparing 2026 Forecasts
- Write down the timestamp. Do not compare a February PECOTA release with an August FanGraphs page as if both describe the same information set.
- Name the provider and mode. “Computer projection” is too vague when FanGraphs alone offers several strength modes.
- Separate the columns. Identify actual record, projected rest-of-season record and projected full-season record before quoting a win total.
- Check schedule treatment. Neutral projected standings and schedule-aware playoff odds are related but answer different questions.
- Look for a distribution. A range or percentile band communicates uncertainty better than one rounded win total.
- Audit roster changes. Confirm that major trades, injuries and returns are reflected in the page's playing-time assumptions.
- Verify the official race. Forecasts interpret possibilities; actual standings determine position, games behind and qualification.
Avoid creating false consensus by casually averaging percentages from incompatible systems. If PECOTA and FanGraphs disagree, preserve the disagreement and explain the likely source: input data, player forecasts, playing time, schedule handling or simulation design. The spread is useful information about model uncertainty.
Our research illustrates why timestamps cannot be optional. The FanGraphs methodology page examined for this guide was updated August 11, but the accessible Projected Standings capture used for structural examples reflected July 12 records. We therefore did not label its team totals as an August 12 forecast. The February PECOTA comparisons also remain explicitly preseason.
Bottom line: public systems can estimate the center and range of the 2026 finish, but none supplies an official future table. Use their latest pages for current values, preserve the model name and timestamp, and judge projected records alongside schedule and roster assumptions. This article offers the method for reading those forecasts—not an MLBSchedule-owned model, a copied proprietary table or a promised outcome.
Loading comments...