
X-W/L means expected win-loss record. In an expanded MLB standings table, it estimates how many games a team would be expected to have won and lost from two season totals: runs scored and runs allowed. You may also see the idea called Pythagorean winning percentage or Pythagorean record.
The column does not revise the results on the field. A club listed at 68-52 is still 68-52 even if its X-W/L says 64-56. The actual record determines its place in the division and Wild Card race; the expected record is an analytical comparison. Its value is that it asks a useful second question: does the team's overall scoring performance look as strong as its wins and losses?
This guide explains the formula, shows a calculation, and sets practical limits on what the number can prove. For the changing values themselves, use our current MLB standings, where the official record remains the starting point. Then use X-W/L as context—not as an alternate table that awards or removes victories.
What X-W/L Means in an MLB Standings Table
The “X” stands for expected, while W/L stands for wins and losses. Unlike a projection built from a future schedule, the number summarizes scoring that has already happened. It takes a team's season-to-date run production and run prevention and asks what record those totals would ordinarily support.
The easiest way to read an expanded table is from left to right. Start with W and L, the games the team actually won and lost. RS is runs scored, and RA is runs allowed. DIFF, or run differential, is RS minus RA. A team with 540 runs scored and 500 allowed has a +40 differential. X-W/L turns the relationship between those run totals into a familiar record, such as 63-57.
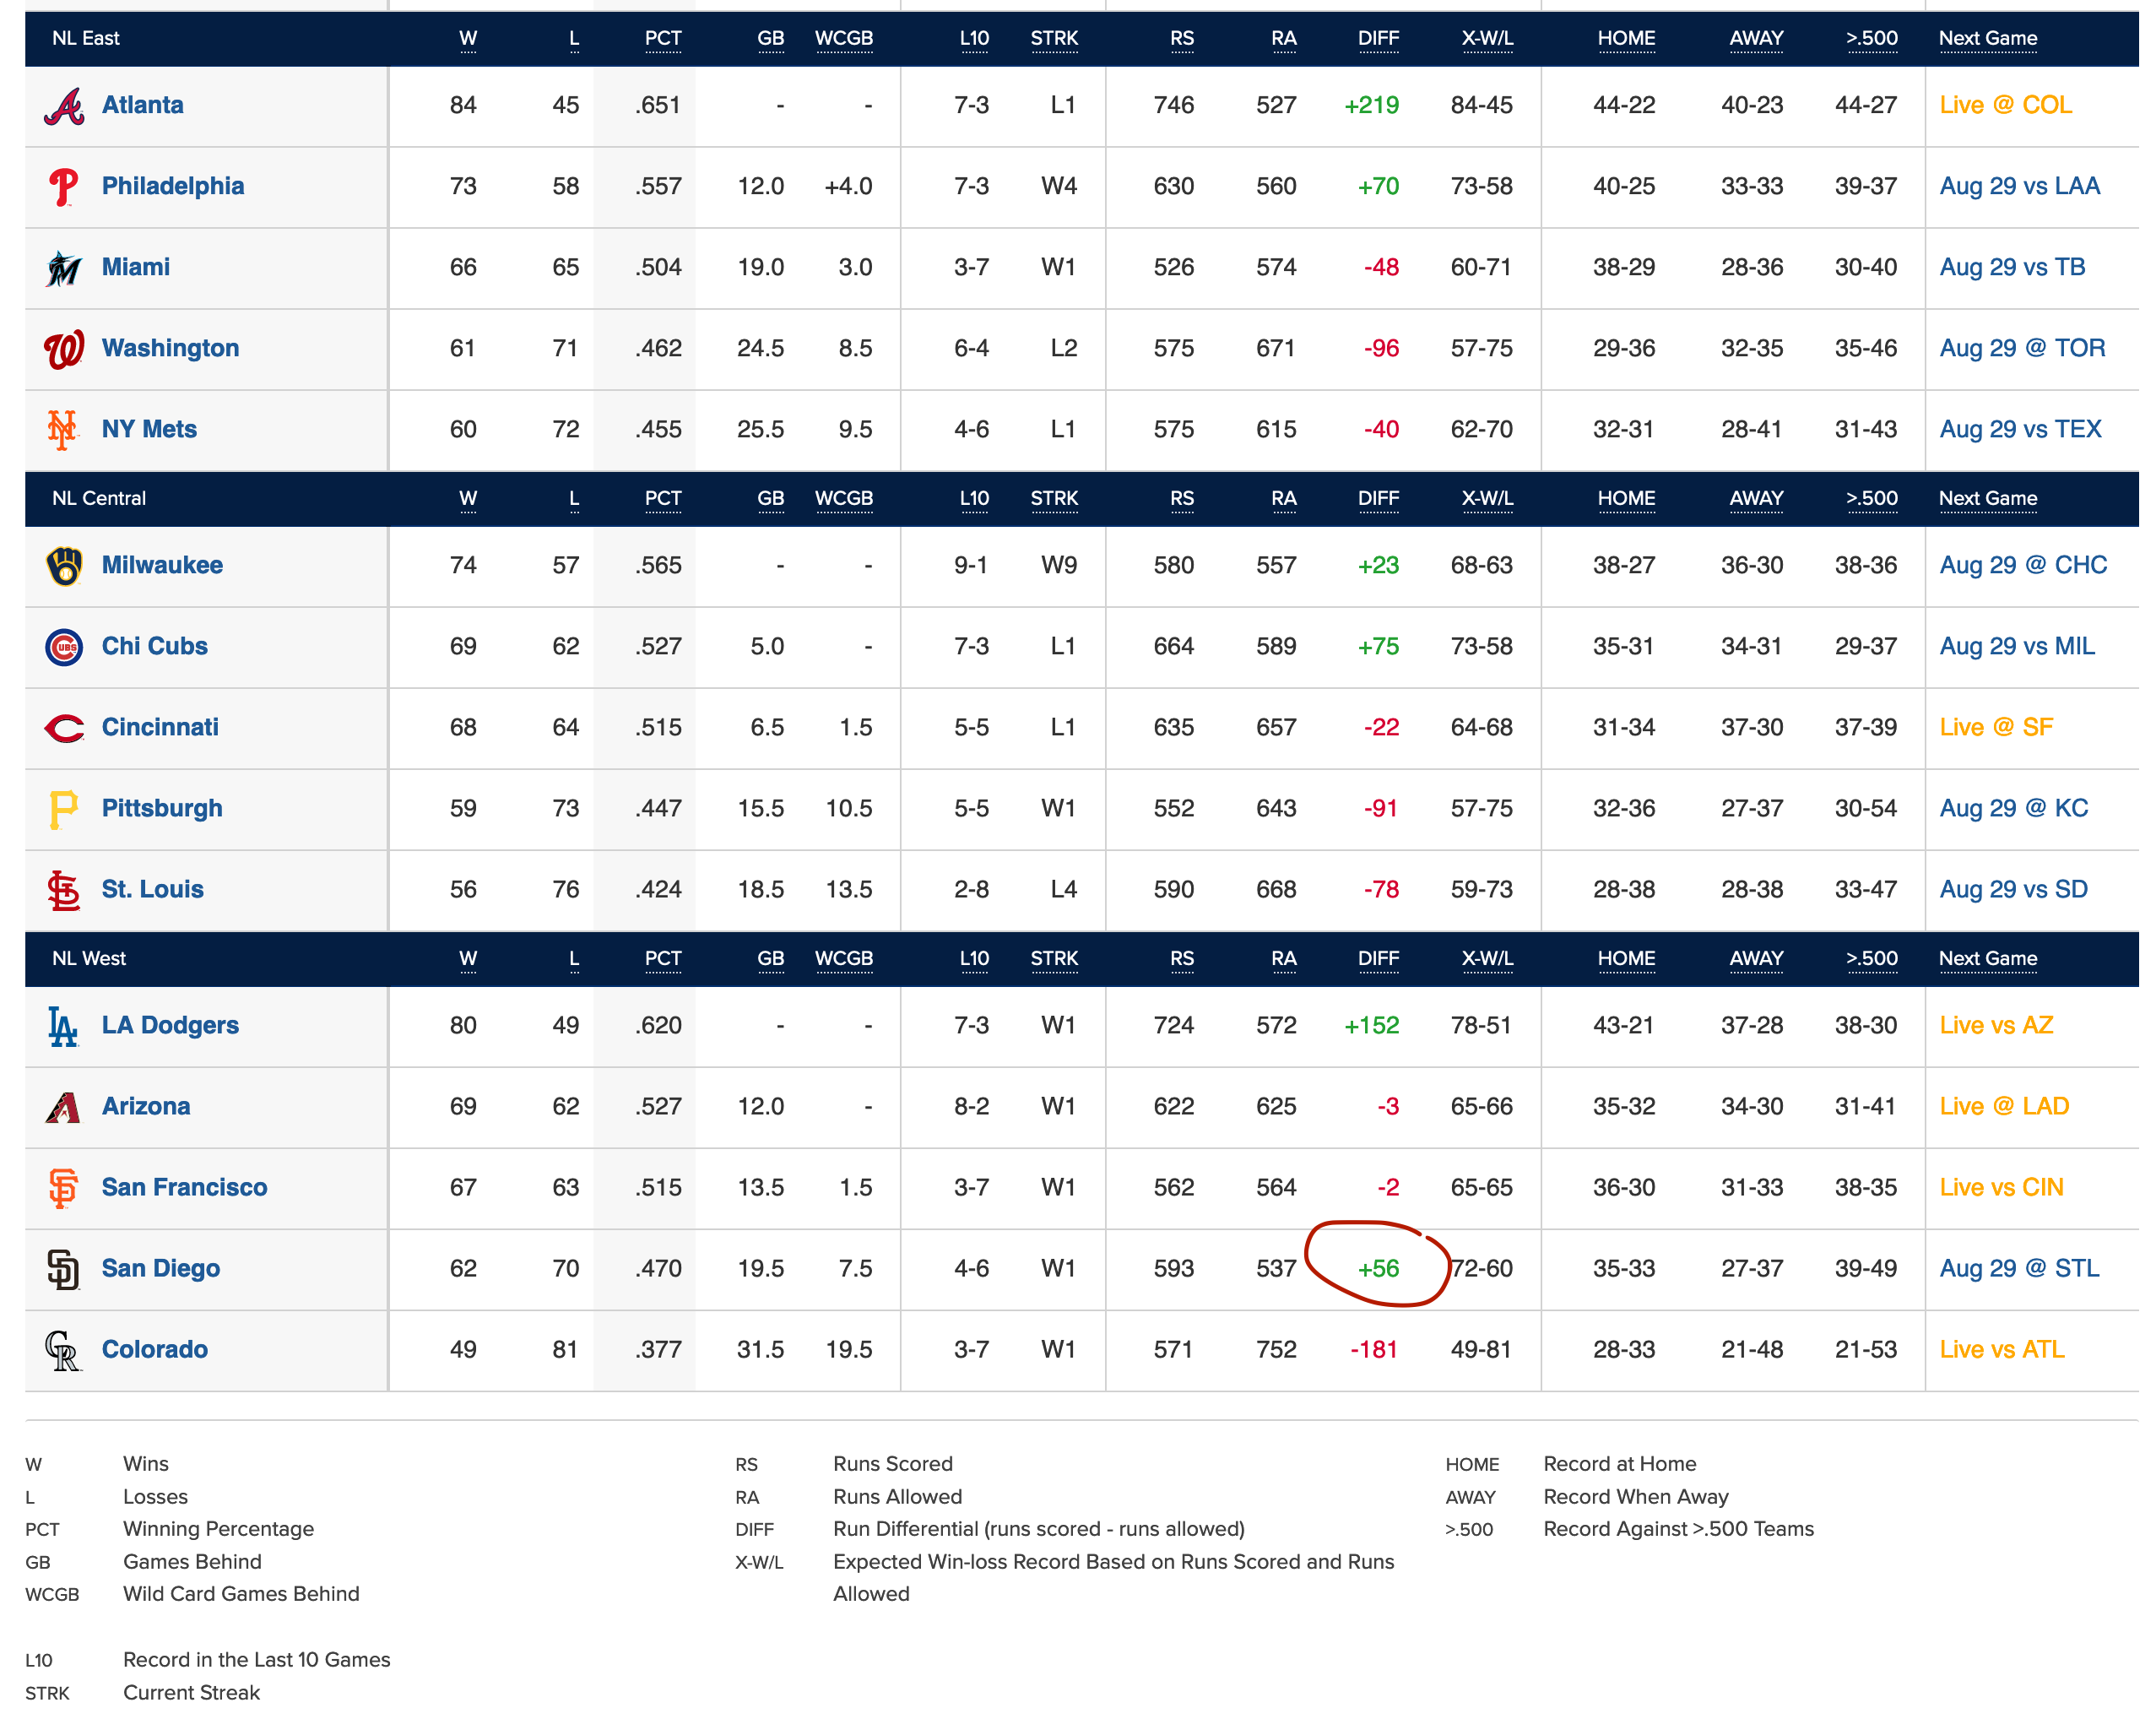
That ordering matters because X-W/L is not an independent grade created from scouting reports, player forecasts or upcoming opponents. It is a compact translation of RS and RA. Two teams may own the same actual record but show different expected records if one has consistently outscored opponents while the other has been outscored overall.
Not every publisher displays the same fields. MLB's expanded view includes X-W/L, while another standings provider may stop at run differential or add its own projection columns. When numbers disagree, first confirm that you are comparing the same date, games played and formula. Most importantly, never move a team up or down the official standings because of X-W/L. Division position, winning percentage, games behind and Wild Card position are based on results, not the estimate.
How Expected Win-Loss Is Calculated
The calculation belongs to a family of formulas known as Pythagorean expectation, developed for baseball by Bill James. The original version squares each run total:
Expected winning percentage = RS² ÷ (RS² + RA²)
The name comes from the formula's visual resemblance to the Pythagorean theorem, not because a baseball diamond or a right triangle drives the result. The logic is simpler: scoring more runs relative to the number allowed should correspond to winning more often. Equal RS and RA always produce an expected percentage of .500. As the ratio moves in either direction, the expected percentage moves above or below .500.
You may not reproduce the displayed column exactly with the square-exponent version. MLB's glossary notes that Baseball-Reference uses 1.83 rather than 2, and other analysts have developed formulas that adjust the exponent for the scoring environment. Publishers can also differ in when their data refreshes and how they round fractional expected wins. That is why the source and timestamp matter when comparing two tables.
A Step-by-Step Example
Suppose a team has played 120 games, scoring 500 runs and allowing 450. Using an exponent of 1.83, the setup is:
5001.83 ÷ (5001.83 + 4501.83) = .5481
Multiply .5481 by 120 games and the result is 65.8 expected wins. Subtract that from 120 for 54.2 expected losses. A standings table must show whole games, so it will ordinarily display about 66-54. If the club's actual record is 62-58, it sits roughly four wins below that estimate.
Do not multiply the percentage by 162 when trying to reproduce a season-to-date X-W/L column. The displayed expected record describes the games already played. Multiplying by 162 instead creates a full-season pace—about 89 wins in this example—and quietly changes the question. It also assumes the same scoring relationship continues, which is a forecast rather than a standings calculation.
How to Read the Gap Between Actual and Expected Record
Subtract expected wins from actual wins to describe the gap. If a 120-game team is 69-51 with an X-W/L of 65-55, it is four wins above expected. If the actual and expected records are reversed, it is four wins below expected. Those phrases are clearer and more defensible than immediately calling the team lucky or unlucky.
A gap often develops because runs are distributed unevenly across games. Imagine a club that wins six close games by one run but loses twice by eight runs. It owns a 6-2 record in that sample even though it has been outscored 22-12. Every actual win counts equally in the standings, but the lopsided losses weigh heavily in RS and RA, pushing the expected record downward. Reverse the pattern—two blowout wins and six narrow losses—and X-W/L can look better than the real record.
Close-game results invite explanations. A strong bullpen, good defense, lineup depth and careful leverage management may help a club protect narrow leads. But the basic expected-record calculation does not inspect any of those mechanisms; it sees only final run totals. It also cannot determine whether a large gap came from repeatable skill, temporary roster construction, an unusual cluster of blowouts or simple variation.
That is why “regression” needs precise wording. X-W/L can signal that the actual record and scoring record tell different stories. It does not promise that the next four games will erase a four-win gap, nor does a team owe the standings any future losses. Future performance may move closer to the scoring-based estimate, the run totals may move toward the actual record, or personnel changes may create a new level of play altogether.
A famous illustration in MLB's glossary is the 2018 Mariners. Seattle finished 89-73 despite allowing 34 more runs than it scored, while Baseball-Reference's Pythagorean record was 77-85. That large difference was a warning about repeatability, not a request to rewrite the final standings. Seattle earned all 89 wins; the expected record simply described how unusual that combination of results and run totals was.
Why X-W/L Can Be More Informative Than Run Differential Alone
Run differential tells you the net scoring margin, but it does not immediately tell you what that margin tends to mean in wins. A +50 looks favorable; X-W/L translates the same scoring relationship into the language fans already use. Seeing an expected record of 67-53 makes the implied performance level and its gap from an actual 62-58 record much easier to grasp.
The translation is not a fixed “runs per win” conversion. A +50 differential built from 550 RS and 500 RA does not have precisely the same proportional meaning as +50 built from 350 RS and 300 RA. The formula compares the size of RS with RA, not only the subtraction result. Games played matters too: +50 over 60 games is a different rate from +50 over 150.
X-W/L is also convenient for comparing teams at a glance. Actual wins, expected wins and the difference between them are all expressed on the same scale. You do not need to decide intuitively whether +37 runs should equal two wins, five wins or something else. The estimate supplies a consistent translation under its chosen formula.
That convenience should not become false precision. Expected record is not automatically superior to every projection, rating or roster-based model. Its strength is economy: it summarizes two observed run totals in a familiar form. For a fuller reading, open the games scheduled today and ask what has recently changed—starting pitchers, injuries, travel or opponent quality—before turning a backward-looking signal into a prediction.
What X-W/L Cannot Tell You
The formula knows only runs scored and runs allowed. It does not know which opponents produced those totals, whether the next month is easier or harder, or whether the club played more games at home. It has no direct input for a trade, an injured ace, a rested bullpen, a rookie promotion or the quality of tomorrow's starting-pitcher matchup. Review the complete MLB schedule before assuming an expected pace will continue unchanged.
It also does not separate the processes that created each run. A bloop hit, a walk, elite contact and a defensive mistake all flow into the final RS or RA total. More elaborate systems can estimate what scoring “should” have resulted from component performance, but basic X-W/L starts after runs have crossed the plate. It removes some timing noise from the conversion of runs into wins, not every kind of randomness or sequencing in baseball.
Expected record cannot certify a team's true talent. Calling a 77-85 club with an 81-81 expected record a “true .500 team” skips uncertainty, changes in player availability and the possibility that the four-game gap contains both skill and variation. A useful estimate is still an estimate. The farther it is stretched beyond the data it uses, the weaker the conclusion becomes.
Nor does X-W/L replace playoff rules. Postseason berths are awarded from actual results and MLB's tiebreaking procedures, not expected wins. If two clubs are tied in the official race, a superior expected record may inform your opinion about which looks stronger, but it does not settle the seed. Our MLB playoff format guide explains the structure that actually governs qualification and first-round byes.
- Use X-W/L for: identifying a meaningful difference between scoring performance and results.
- Do not use it for: changing an official record, declaring causation, or guaranteeing regression.
- Add context from: roster news, opponent quality, home-road splits, recent underlying performance and remaining schedule.
How Fans Can Use X-W/L During the Season
The best use is as a prompt for a second look. Begin with the actual race, because those wins and losses create today's stakes. Then compare X-W/L and investigate a sizable gap instead of treating the gap itself as the conclusion.
- Record the snapshot date and games played. Expected record changes whenever RS or RA changes, so comparisons from different mornings can mislead.
- Measure the gap. Subtract expected wins from actual wins and note whether the team is above or below the estimate.
- Inspect the run pattern. Check DIFF and recent scores. Determine whether a small number of extreme games created much of the margin.
- Check what has changed. Injuries, trades, promotions and bullpen workload can make old run totals less representative of the roster playing now.
- Review upcoming opponents. A difficult road trip and a soft homestand are not encoded in season-to-date X-W/L.
- Revisit the signal. One series can swing an early-season number. A longer sample gives the run relationship more meaning.
This routine works especially well when evaluating a surprising contender or a talented team stuck below .500. It makes you ask whether the official record, the scoring record and the current roster point in the same direction. If all three agree, confidence grows. If they conflict, uncertainty—not certainty—is the honest takeaway.
Keep the roles separate on game day. Use the standings tracker for the current race, the daily game list for immediate matchups, and the full schedule for what comes next. X-W/L helps explain the past and frame expectations; those other views tell you what has officially happened and what is actually scheduled.
Quick Answers About Expected Win-Loss
Does the X in X-W/L mean expected?
Yes. X-W/L is shorthand for expected win-loss record. The expected value comes from the relationship between runs scored and runs allowed, not from changing any game's final result.
Is X-W/L an MLB playoff tiebreaker?
No. Expected record is an analysis column, not a postseason tiebreaker. Teams qualify and receive seeds through actual results and the applicable MLB procedures. A better X-W/L carries no official advantage.
Why does X-W/L differ between websites?
Check the data date first. If both sites include the same completed games, a difference may come from the exponent, the specific formula variant or rounding. Treat the publisher's label and methodology as part of the statistic.
Can a winning team have a negative run differential?
Yes. A club can win many close games and lose fewer games by large margins, producing more wins than losses while allowing more total runs than it scores. Its X-W/L will usually be worse than its actual record.
Does a gap guarantee regression?
No. A gap identifies disagreement between results and overall scoring. It can support a regression case, especially over a meaningful sample, but it does not set a deadline or direction for the next game. Roster and schedule changes can alter the team's future performance before the records converge.
How often does expected record update?
It can change after every completed game because RS, RA and games played all update. For that reason, cite the date when discussing a team's gap. A static article should explain the column; a standings page should supply the latest number.
The durable lesson is simple: actual W-L answers what happened, while X-W/L asks what record the scoring balance would normally support. Read them together. The space between them is an invitation to investigate, not permission to erase wins, declare luck or treat a compact formula as a complete forecast.
Loading comments...