

Boston made the strongest move after the 2026 All-Star break, going 18-7 through games completed August 11. Atlanta and Tampa Bay followed at 17-8, while the Cubs, Detroit and San Diego also played at least .640 baseball during the comparison window. At the other end, the Athletics went 6-18 and Cleveland fell from second to fourth in the AL Central with a 7-16 run.
This is a dated standings analysis, not a live table. The snapshot was prepared on August 12, 2026, using records after the final pre-break games on July 12 and records through August 11. Results beginning August 12 are deliberately excluded so every comparison shares a fixed cutoff.
The division picture did not completely turn over. Five of the six clubs that led at the break still led at this snapshot. The major exception was the AL West, where Houston climbed from third to first. The more revealing changes happened beneath the leaders: Boston created Wild Card breathing room, Detroit gained two division positions, and several contenders lost ground. Readers seeking the latest numbers should use the live MLB standings page; the purpose here is to explain how the race changed during one specific month.
How This Standings Comparison Was Measured
The 2026 All-Star Game was played Tuesday, July 14, during the July 13-16 break in regular-season club schedules. We use the records after Sunday, July 12 as the baseline because every win and loss in that table came before the break. The endpoint is after games completed Tuesday, August 11. That creates a clean baseball window rather than comparing two pages captured at arbitrary times during live games.
Both snapshots came from the MLB Stats API's regular-season standings endpoint for the American and National Leagues. For each club, post-break wins equal its August 11 win total minus its July 12 total. Losses are calculated the same way. The post-break winning percentage is wins divided by the sum of those wins and losses.
For example, Boston moved from 46-48 to 64-55. Subtracting the two records gives 18 wins and seven losses, or .720. Detroit moved from 44-52 to 59-60, producing a 15-8 record and a .652 percentage. The process does not estimate strength or assign credit; it simply isolates results between the two dated standings.
Clubs played between 23 and 25 games in this window, so ranking only by wins would unfairly favor teams with more games. The tables below rank by winning percentage, then show the record so the sample size remains visible. Division position is treated separately: a good record does not guarantee a rank gain when a leader also plays well.
There are two additional boundaries. First, the Wild Card “games ahead” figures reproduce the MLB snapshot and are not forecasts. Second, a result on August 12 can already make a listed margin look stale. That is normal for historical analysis. Use this fixed comparison to understand the movement, then consult the standings page for everything that happened afterward.
The Biggest Risers Since the All-Star Break
| Rank | Team | Break record | Aug. 11 record | Post-break | PCT |
|---|---|---|---|---|---|
| 1 | Boston Red Sox | 46-48 | 64-55 | 18-7 | .720 |
| T-2 | Atlanta Braves | 55-40 | 72-48 | 17-8 | .680 |
| T-2 | Tampa Bay Rays | 56-38 | 73-46 | 17-8 | .680 |
| 4 | Chicago Cubs | 54-42 | 70-50 | 16-8 | .667 |
| 5 | Detroit Tigers | 44-52 | 59-60 | 15-8 | .652 |
| 6 | San Diego Padres | 48-48 | 64-57 | 16-9 | .640 |
“Riser” here means best record during the window, not necessarily most places climbed. Boston and Detroit converted strong runs into obvious standings improvement. Atlanta and Tampa Bay were already division leaders, while the Cubs remained behind Milwaukee and San Diego remained third in the NL West. Playing well can defend a position or prevent a deficit from growing even when the rank column stays unchanged.
The table also shows why percentage is the fair ranking. Detroit won one fewer game than the Cubs and Padres, but it played only 23 times, so 15-8 edges 16-8 and 16-9 by rate. Those differences are small enough that a single result can reorder the list. To see the matchups that will shape the next version of the race, check the MLB games today page instead of extending this snapshot beyond its cutoff.
Six clubs above .640 is a reminder that post-break movement is relative. Atlanta's 17-8 would have gained enormous ground on an average rival, but division competitors can surge simultaneously. The standings consequence depends on where a club started and what the teams around it did, not only on how impressive its isolated record looks.
Boston Turned a Wild Card Chase Into a Cushion
Boston's 18-7 record changed the practical meaning of its season. The Red Sox entered the break 46-48, third in the AL East and half a game outside the last American League Wild Card position. By the August 11 endpoint they were 64-55. They still ranked third in a difficult division, but MLB's standings listed them 4.5 games above the Wild Card cutoff rather than chasing it.
The run was larger than this comparison window alone suggests. MLB reported that Boston finished July 21-4, the most wins it had posted in a month since August 2004 and the best winning percentage for a full month in franchise history. Because the pre-break baseline comes after July 12, our 18-7 figure intentionally captures only the games on the chosen side of the break; it should not be confused with the entire calendar month.
Starting pitching supplied visible support for the surge. On August 8, rookie Payton Tolle struck out 14 Athletics over six innings while allowing two hits and no walks in a 13-1 win. MLB reported that the victory was Boston's ninth straight and its 27th in 30 games. One dominant start does not explain a month, but it shows how run prevention helped a club keep stacking wins even after an exhausted bullpen had covered 13 innings the previous night.
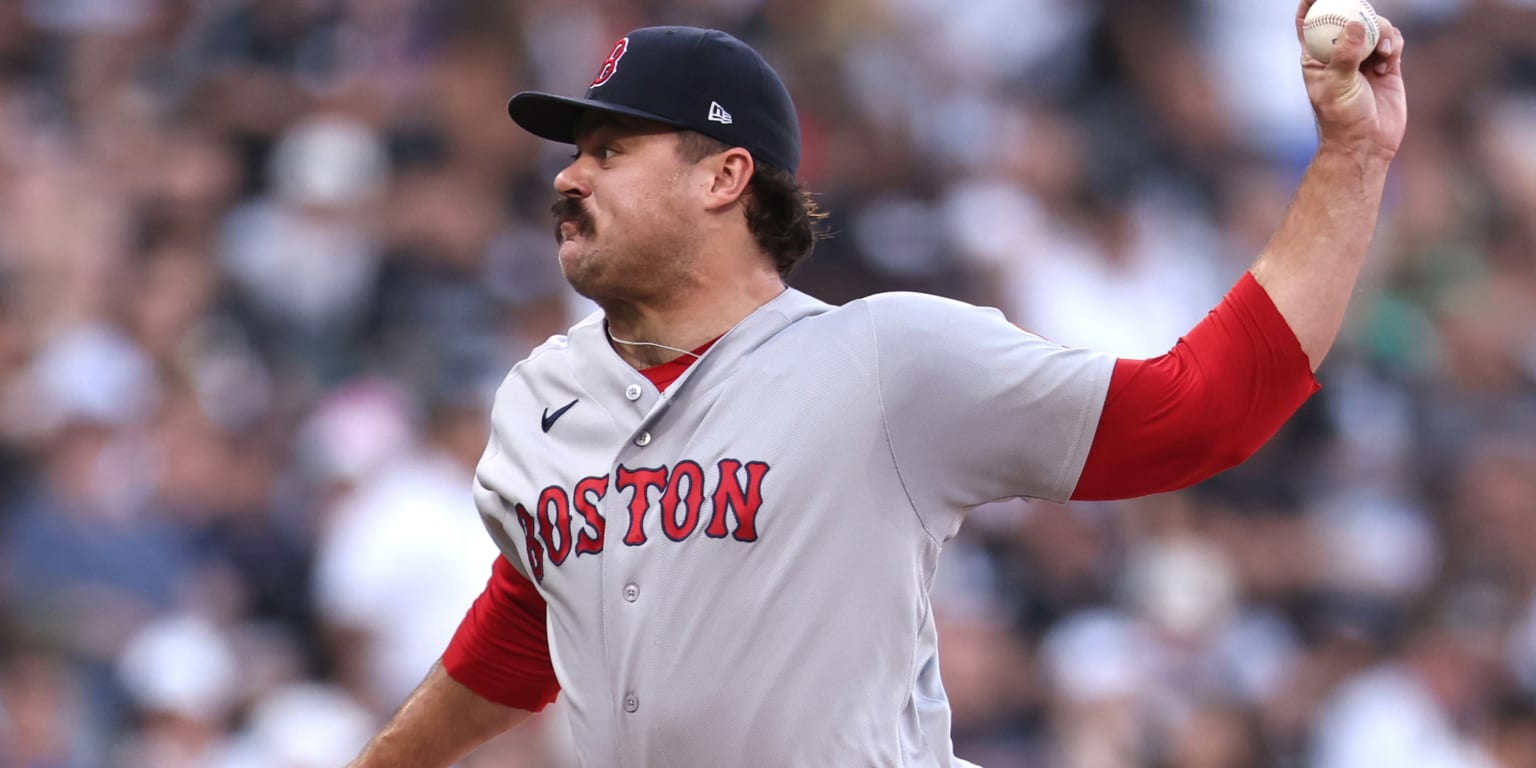
The correct conclusion is narrower than “Boston solved everything.” The Rays remained the AL East leader at 73-46, nine games ahead of the Red Sox in this snapshot. Boston's achievement was turning a precarious outside position into meaningful separation around the Wild Card line. That cushion could shrink quickly, but it changed the team's path: competitors now needed to catch Boston while the Red Sox could focus on sustaining rather than merely reaching a postseason pace.
Detroit and Houston Made the Biggest Division Moves
Detroit was the only team to gain two places within a division. The Tigers went into the break 44-52 and fourth in the AL Central. A 15-8 response lifted them to 59-60 and second by August 11, 2.5 games behind the White Sox and half a game outside the final Wild Card. The change was not merely cosmetic: Detroit moved from a crowded lower tier to direct pressure on both the division leader and postseason cutoff.
The rise was visible early. MLB reported on July 23 that Detroit had won five of its first seven games after the break. Yet the roster at the endpoint was not the roster that built the entire run. The Tigers traded Tarik Skubal to the Dodgers on August 1. That deadline decision makes the snapshot especially useful as history but more dangerous as a straight-line forecast. Detroit banked the wins; whether it could maintain the rate after moving an ace was a new question.
Houston's movement was even more consequential because it ended in first place. The Astros were 47-51 and third in the AL West at the break, then went 14-9 to reach 61-60. Texas moved from 49-47 to 60-60 during the same window. That left Houston ahead by half a game and turned the AL West into the only division with a new leader.
MLB's July 31 account captured the turning point. Houston beat Texas 11-2 to move into sole possession of first for the first time since April 6. The Astros were 9-1 over their previous ten at that moment, a rebound that followed a sweep by Baltimore immediately after the break. They also secured the season series against Texas, a relevant detail if the clubs finish tied.
These two cases show different kinds of movement. Detroit climbed the ladder inside a division but remained below .500 and outside the playoff field. Houston crossed from third to first despite owning only a one-game advantage over .500. A position can change rapidly in a compressed race. Before projecting either trajectory, inspect the remaining MLB schedule, head-to-head opportunities and the rosters that will actually play those games.
The Biggest Fallers Since the Break
| Team | Break record | Aug. 11 record | Post-break | PCT | Division change |
|---|---|---|---|---|---|
| Athletics | 41-55 | 47-73 | 6-18 | .250 | 4th to 4th |
| Cleveland Guardians | 51-46 | 58-62 | 7-16 | .304 | 2nd to 4th |
| Pittsburgh Pirates | 50-47 | 58-63 | 8-16 | .333 | 4th to 5th |
| Seattle Mariners | 48-49 | 56-64 | 8-15 | .348 | 2nd to 3rd |
| Los Angeles Angels | 38-59 | 46-74 | 8-15 | .348 | 5th to 5th |
The Athletics owned the lowest percentage in the window, but Cleveland suffered the costliest positional fall. The Guardians were 51-46 and second in the AL Central at the break. A 7-16 stretch flipped them to 58-62 and fourth, four games behind Chicago and two games outside the last Wild Card. An MLB team report after a series loss to the White Sox described the continuing pattern as a second-half slide.
Pittsburgh also crossed an important line. The Pirates began 50-47, three games above .500, then went 8-16 and landed at 58-63. Their move from fourth to fifth did not look as dramatic as Cleveland's two-place drop, but a five-game swing from above to below .500 increased the ground they needed to recover in a crowded National League chase.
Seattle's 8-15 run had division consequences because the AL West was so compressed. The Mariners moved from second and one game below .500 to third at 56-64, 4.5 games behind Houston. Recent MLB coverage pointed to repeated low-scoring games, including a 2-1 loss in which Seattle avoided a shutout only with a ninth-inning homer. The snapshot identifies the slide; that game-level detail helps explain why adding wins had become difficult.
The Angels matched Seattle's .348 percentage but stayed fifth, while Oakland remained fourth. This distinction matters: “faller” can mean poor performance, loss of rank, loss of playoff position or all three. A team that started far behind may post the worst record without changing places. Cleveland's 7-16 was less severe than Oakland's 6-18 by percentage, yet it transformed a much more competitive starting position.
Which Division Leaders Held Their Ground
Five break leaders were still on top at the August 11 cutoff: Tampa Bay in the AL East, the White Sox in the AL Central, Atlanta in the NL East, Milwaukee in the NL Central and the Dodgers in the NL West. Houston replacing Texas in the AL West was the only change. Stability across five divisions, however, should not be mistaken for identical levels of safety.
Tampa Bay and Atlanta strengthened first-place records with matching 17-8 runs. Milwaukee went 15-9 and held off a Cubs club that went 16-8, leaving Chicago four games back. The Dodgers were less dominant at 10-12, yet still led the NL West by eight games over Arizona and San Diego. Different paths—surging with the challenger, widening a margin or relying on an existing cushion—can all produce the same “still first” label.
The AL Central was much tighter. Chicago went 11-12 after the break but remained first at 61-57. Detroit's 15-8 surge cut the margin to 2.5 games, while Minnesota sat 3.5 back. Cleveland's slide did not merely hurt the Guardians; it rearranged the set of teams applying pressure to the leader.
Wild Card position also complicates the division view. The Cubs' 70-50 record placed them comfortably above the National League cutoff even while they chased Milwaukee. San Diego and Arizona shared 64-57 records in the snapshot, with the official table ordering them within the division. Rank alone cannot tell a fan whether a team has a second route into October.
That second route is why the playoff structure matters. Division winners and Wild Cards are not interchangeable, and the top two division winners in each league receive first-round byes under the current format. The MLB playoff format explainer puts these dated margins into the rules that determine seeding. A stable division lead can therefore affect both qualification and the path after qualification.
What This Snapshot Means for the Stretch Run
Most clubs had played between 118 and 121 games by the August 11 endpoint. In a 162-game season, that left roughly 41 to 44 games—enough time for a four-game margin to disappear, but not enough to treat every poor week as harmless. Boston had built real protection, Houston had seized a real lead, and Detroit had created a credible route back. None of those facts guaranteed the final order.
The next question is schedule shape. Head-to-head games can move a race twice as efficiently because one contender gains while another loses. Home-road balance, rest, travel and opponent quality also differ. A .650 post-break pace earned against one set of opponents does not mechanically carry into the next set. Use the full schedule and daily matchups to identify where the standings can change, rather than multiplying a short-window percentage across every remaining game.
Roster context is equally important. The trade deadline altered clubs between the beginning and end of this sample, with Detroit's Skubal trade providing the clearest warning. Injuries, returns and bullpen fatigue can change team quality without erasing any already completed result. The snapshot tells us which teams gained ground under the conditions they faced; it does not freeze those conditions.
For October planning, compare the current field with the 2026 MLB playoff schedule and bracket guide. Then return to the standings to see whether division and Wild Card positions have changed since August 11. That sequence keeps three questions separate: what happened during this post-break window, where teams stand now, and how the postseason would be organized if those positions held.
Snapshot conclusion: through August 11, Boston was the biggest record-based riser, Detroit gained the most division places, Houston produced the only change at the top of a division, and the Athletics posted the lowest post-break percentage. Those are verified observations from a fixed August 12 analysis—not final standings and not predictions. The remaining schedule still decides the season.
Loading comments...