
MLB Power Rankings 2026: All 30 Teams at a Glance
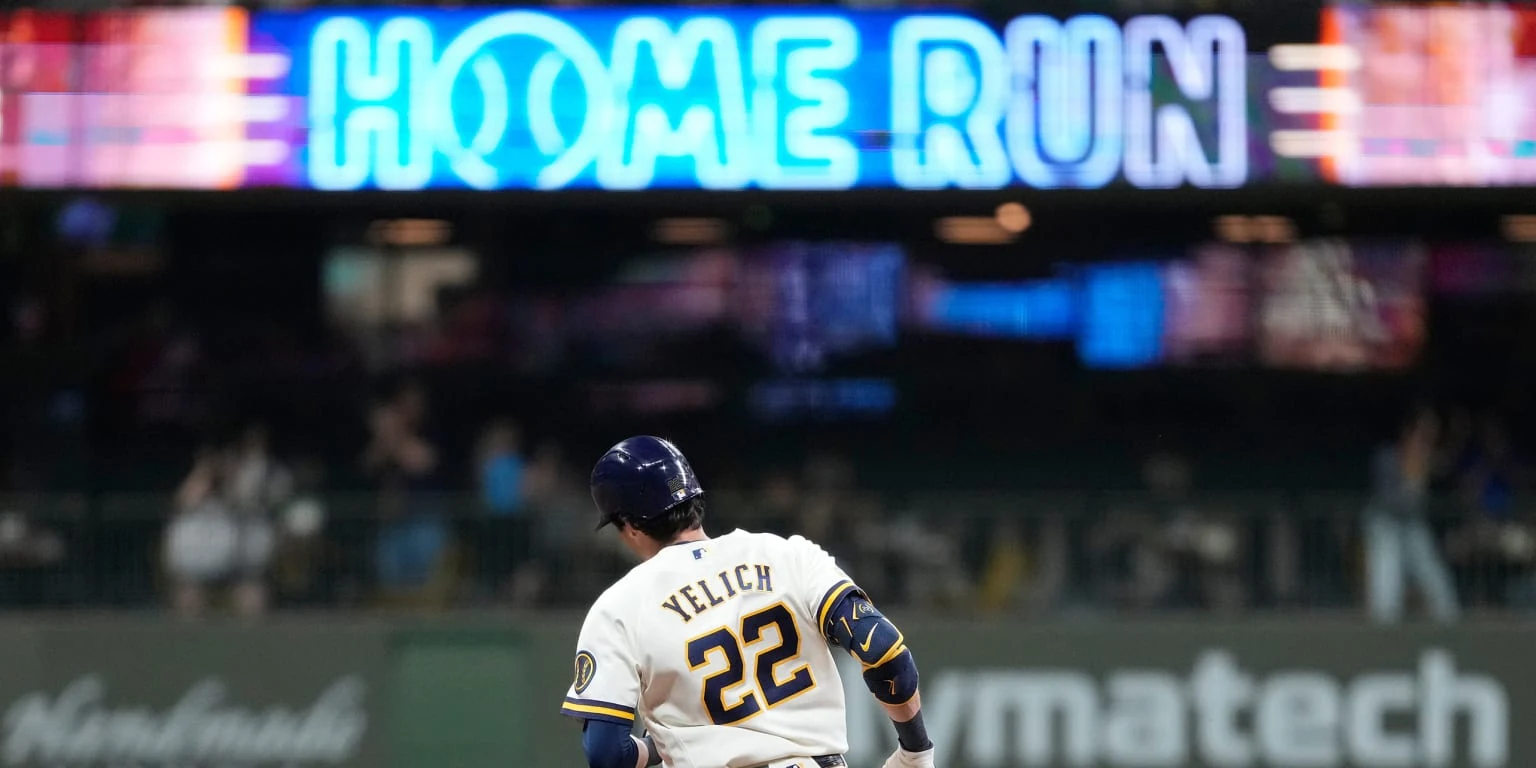
Updated August 19, 2026, using games completed through August 18: the Milwaukee Brewers are No. 1 in this results-based MLB power ranking, while the Athletics are No. 30. Milwaukee owned the best record in baseball at 78-48 and the best run differential at +158. The Athletics had the lowest winning percentage at 49-77 and the largest negative run differential at -179.
This is a dated snapshot, not a forecast of the World Series. The order combines season-long performance, scoring margin and recent form so that one winning streak does not erase four months of evidence. The “index” column is a weighted average of rank positions; a lower number is better. It is not a win probability, championship probability or betting line.
| Rank | Team | Record | Run diff. | Last 10 | Index |
|---|---|---|---|---|---|
| 1 | Milwaukee Brewers | 78-48 | +158 | 6-4 | 1.8 |
| 2 | Los Angeles Dodgers | 76-51 | +143 | 6-4 | 3.1 |
| 3 | Tampa Bay Rays | 75-50 | +48 | 6-4 | 4.4 |
| 4 | Chicago Cubs | 74-53 | +103 | 6-4 | 4.7 |
| 5 | New York Yankees | 70-55 | +87 | 6-4 | 5.8 |
| 6 | Atlanta Braves | 74-52 | +112 | 4-6 | 6.7 |
| 7 | Philadelphia Phillies | 69-58 | +12 | 7-3 | 7.8 |
| 8 | Chicago White Sox | 65-60 | +44 | 6-4 | 8.7 |
| 9 | San Diego Padres | 68-59 | +5 | 8-2 | 9.2 |
| 10 | Boston Red Sox | 68-58 | +96 | 4-6 | 9.3 |
| 11 | St. Louis Cardinals | 65-62 | +10 | 7-3 | 10.6 |
| 12 | Miami Marlins | 64-63 | +17 | 6-4 | 10.8 |
| 13 | Arizona Diamondbacks | 66-61 | +3 | 4-6 | 13.6 |
| 14 | Detroit Tigers | 61-65 | +83 | 5-5 | 13.7 |
| 15 | Pittsburgh Pirates | 62-66 | +30 | 5-5 | 14.6 |
| 16 | Toronto Blue Jays | 62-65 | -52 | 7-3 | 15.6 |
| 17 | Houston Astros | 63-63 | -32 | 4-6 | 16.5 |
| 18 | Baltimore Orioles | 61-65 | -29 | 5-5 | 17.0 |
| 19 | Texas Rangers | 62-64 | -42 | 4-6 | 17.3 |
| 20 | Cleveland Guardians | 61-65 | -25 | 4-6 | 17.9 |
| 21 | Minnesota Twins | 62-65 | -43 | 4-6 | 18.1 |
| 22 | Washington Nationals | 60-67 | +13 | 4-6 | 18.9 |
| 23 | New York Mets | 57-70 | -44 | 6-4 | 20.1 |
| 24 | Cincinnati Reds | 60-66 | -89 | 4-6 | 22.9 |
| 25 | Kansas City Royals | 53-74 | -106 | 5-5 | 24.0 |
| 26 | Los Angeles Angels | 50-76 | -84 | 5-5 | 24.4 |
| 27 | Seattle Mariners | 59-67 | -45 | 3-7 | 24.7 |
| 28 | Colorado Rockies | 50-76 | -120 | 5-5 | 25.3 |
| 29 | San Francisco Giants | 51-74 | -74 | 3-7 | 26.8 |
| 30 | Athletics | 49-77 | -179 | 4-6 | 27.8 |
The top six form an elite group in this model, ranks 7-13 are credible contenders with at least one notable weakness, and the middle is unusually compressed. Only 3.3 index points separate Detroit at No. 14 from Houston at No. 17, so a strong or poor week can produce visible movement there. The bottom is clearer: the four lowest teams all combine losing records with negative scoring margins.
Because the cutoff matters, do not treat this table as a live scoreboard. Check today's MLB games and results for anything completed after August 18, then wait for every input to be refreshed before comparing a future edition with this one.
How These MLB Power Rankings Are Calculated
Power rankings are an editorial comparison, not an official MLB tiebreaker. Standings order teams by games won and lost; this index asks a slightly different question: which clubs have produced the strongest blend of season results, scoring margin and current form? To keep that judgment visible, every team receives a component rank in three categories.
| Component | Weight | What it contributes |
|---|---|---|
| Season winning percentage | 50% | The largest share rewards the complete 2026 body of work. |
| Run differential per game | 30% | Scoring margin adds context about how decisively a club has played. |
| Last-10 winning percentage | 20% | A limited form adjustment recognizes movement without letting one week dominate. |
The formula is 0.50 × winning-percentage rank + 0.30 × run-differential-per-game rank + 0.20 × last-10 rank. A first-place component is worth 1, not 30, which is why a lower final index is stronger. Equal component values receive the same competition rank; the next position skips the number of tied clubs. If two final indexes match, season winning percentage breaks the tie, followed by raw run differential.
Milwaukee supplies a real example. The Brewers ranked first in winning percentage and first in run differential per game. Their 6-4 last 10 was tied at component rank 5. The calculation is 0.50(1) + 0.30(1) + 0.20(5), producing the 1.8 index shown in the table. There is no hidden injury adjustment, payroll bonus or reputation score.
Why use differential per game instead of the raw total in the formula? Clubs can temporarily have played different numbers of games. Dividing by games played puts their scoring margins on the same scale. MLB defines run differential as runs scored minus runs allowed and describes it as a useful performance signal, but also cautions that the best differential does not automatically produce a championship. That limitation matters here.
The weights are choices, not laws of baseball. Giving half the index to the full-season record keeps a hot 10-game streak from overwhelming more than 120 games. Giving 30% to scoring margin can identify a club whose record understates or overstates its overall run balance. The final 20% makes the list responsive enough to mean “right now.” A projection model could add roster strength, injuries and remaining opponents, but this article intentionally does not forecast those variables.
Use the index as a reading guide: check the record, ask whether scoring margin supports it, then see whether recent form is pushing the team up or down. For the game-by-game context behind those inputs, open the complete MLB schedule. A power rank explains a snapshot; it does not replace the results that created it.
Elite Tier: Brewers Lead, With Dodgers and Rays Close
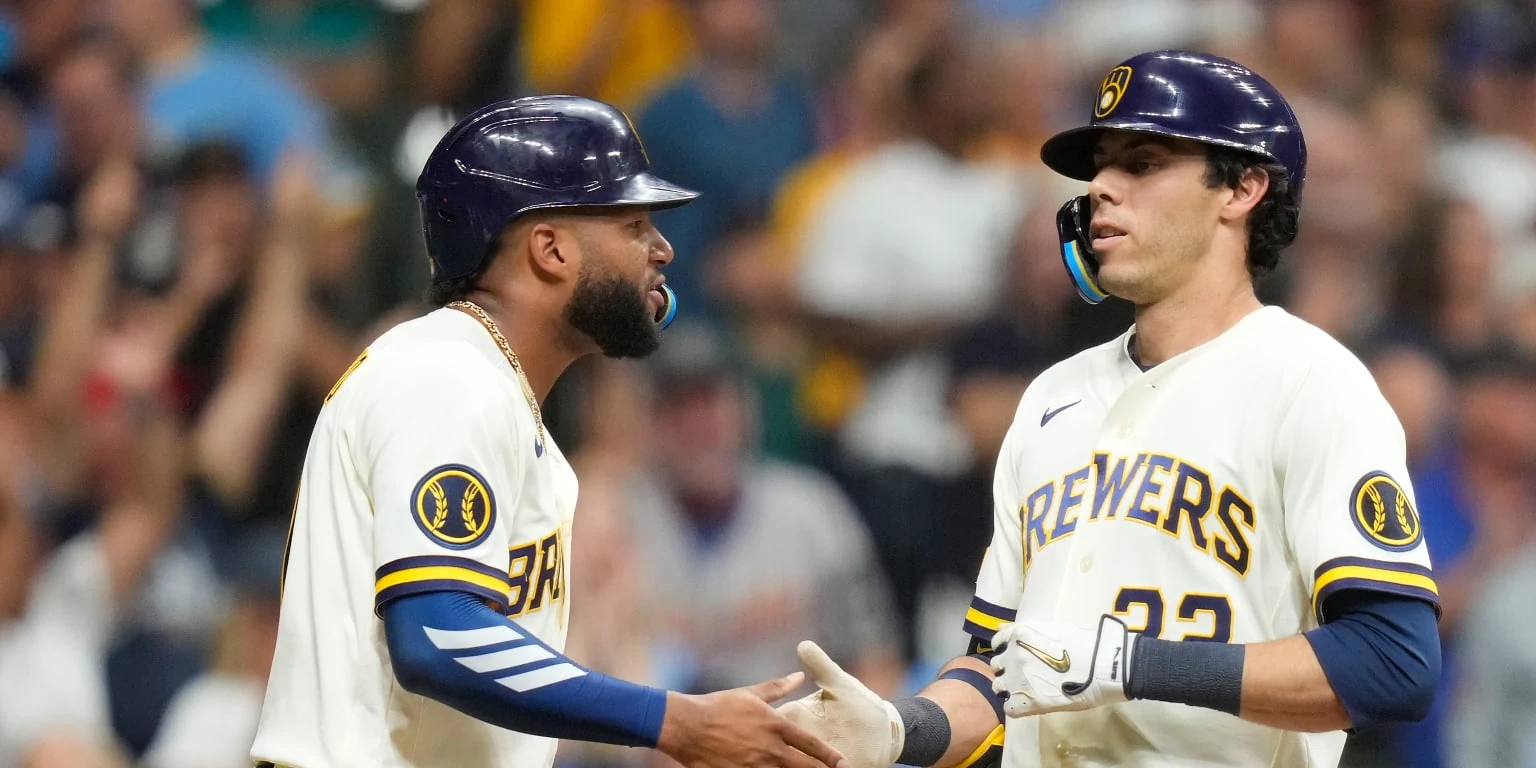
No. 1 Milwaukee has the cleanest profile in the league: first in winning percentage and first in run differential per game, with a solid 6-4 recent record. The Brewers' 22-0 victory over Seattle on August 18 is part of that +158 margin, so it deserves context. One historic blowout can stretch any differential, but Milwaukee led the model on record as well. Removing the spectacle does not turn the league's best record into an illusion.
No. 2 Los Angeles is the closest statistical challenger. The Dodgers were only 2.5 games behind Milwaukee in the snapshot and their +143 differential was nearly as imposing. A 6-4 last 10 neither boosts nor punishes them relative to most of the elite tier. The result is a stable second place based on both winning and margin, not a reputation bonus.
No. 3 Tampa Bay presents a different shape. The Rays' 75-50 record was slightly better than the Dodgers by winning percentage, but their +48 run differential trailed every other club in the top six. That does not invalidate 75 wins. It explains why the balance of the model places Tampa Bay behind Los Angeles rather than copying the standings exactly.
No. 4 Chicago pairs a 74-53 record with a +103 differential and 6-4 form. The Cubs do not lead a component, but they also have no obvious weak component. That consistency edges them ahead of the Yankees and Braves. No. 5 New York follows the same pattern at 70-55, +87 and 6-4: strong across the board, though a step behind the top four over the entire season.
No. 6 Atlanta is the tier's most revealing case. The Braves were 74-52 with a +112 margin—better full-season inputs than Chicago or New York in important respects. Their 4-6 last 10 carries a component rank of 19, however, and the model's 20% form weight pulls them below both. If Atlanta strings together a strong week while preserving its margin, that recent-form drag can disappear quickly.
These six teams have earned separation from the field in a descriptive ranking, but “elite” is not a postseason promise. A short series depends on matchups, availability and small samples that this formula does not forecast. The useful conclusion is narrower: through August 18, these clubs had the strongest combined evidence from wins, scoring margin and recent results.
Strong Contenders and Hot Teams, Ranks 7-13
This tier shows why “right now” cannot mean “last 10 games only.” No. 7 Philadelphia brings the strongest blend near the top of the group: a 69-58 season record and 7-3 recent run. Its +12 differential is modest for a contender, so the Phillies rise on wins and form without receiving the margin support enjoyed by Boston.
No. 8 Chicago is less hot but more balanced. The White Sox were 65-60, +44 and 6-4, landing inside the top 10 in every component. No. 9 San Diego had the best last-10 mark in MLB at 8-2, yet a +5 differential over 127 games says the larger scoring story remained close. That is why the Padres receive a strong recent boost without jumping directly into the elite tier.
No. 10 Boston is the opposite case. A +96 differential was fifth best in the league and far better than any other club in this tier. The Red Sox also owned a 68-58 record, but a 4-6 last 10 applies a meaningful form penalty. A model that ignored recent results would place Boston higher; a list based only on the last 10 would underrate more than 100 earlier games. Tenth is the compromise produced by the declared weights.
No. 11 St. Louis follows Philadelphia's shape on a smaller scale: 65-62, a narrow +10 margin and a 7-3 last 10. No. 12 Miami is steadier at 64-63, +17 and 6-4. The Marlins' index trails the Cardinals by only 0.2, so those spots should be read as neighbors rather than as proof of a large talent gap.
No. 13 Arizona closes the tier at 66-61. The Diamondbacks have the best record of the final three clubs here, but their +3 run differential and 4-6 form both lag. That produces the clearest example in this group of standings position exceeding the other two model signals. It does not mean 66 wins are accidental; it means the ranking asks for corroboration from margin and recent results.
A 7-3 or 8-2 stretch can change a playoff race, but it cannot establish what happens next. Opponents, probable pitchers and venue still matter for an individual game, none of which this broad team index models. Use the MLB schedule for tomorrow to identify the actual next matchups, then evaluate those games on their own information rather than treating a power rank as a pick.
The Crowded Middle, Ranks 14-22
No part of the list is more sensitive to the formula than the middle. Only 5.2 index points separate No. 14 Detroit from No. 22 Washington, and the clubs between them have conflicting signals. That is a reason to examine the inputs, not to pretend the ninth team in this tier is dramatically weaker than the first.
Detroit is the headline outlier. The Tigers were 61-65, yet their +83 run differential ranked seventh in MLB—better than several winning teams. A 5-5 last 10 is neutral. The model therefore lifts Detroit well above its standings position without declaring the record meaningless. Large wins, narrow losses and sequencing can create a gap between record and aggregate margin; differential alone cannot diagnose which explanation applies.
No. 15 Pittsburgh also gets margin support, though its +30 is far less extreme. The Pirates' 62-66 record and 5-5 form keep them close to Detroit. No. 16 Toronto arrives through another route: a 62-65 record and -52 differential are weak inputs, but a 7-3 last 10 supplies the tier's strongest recent-form boost. The Blue Jays can move quickly if that form continues, but “continues” is a condition, not a forecast.
No. 17 Houston sat exactly .500 at 63-63, but a -32 margin and 4-6 recent record prevent a higher placement. No. 18 Baltimore was 61-65 with a -29 differential and 5-5 form. No. 19 Texas owned the best record of those three at 62-64, yet its -42 margin and 4-6 last 10 pull the Rangers just behind the Orioles in the composite.
No. 20 Cleveland and No. 21 Minnesota were separated by only 0.2 index points. The Guardians' -25 margin is better; the Twins' 62-65 record is one win better than Cleveland's 61-65 mark, while both were 4-6 recently. Calling either clearly superior would claim more precision than the data provide.
No. 22 Washington is the second unusual profile. The Nationals were 60-67 and 4-6, but had outscored opponents by 13 runs overall. As with Detroit, that positive margin is evidence worth retaining, not proof that future wins are owed. MLB's own glossary notes that positive-differential losing teams can exist and that the measure is not infallible.
Expect this tier to move most between updates because every completed game affects winning percentage and differential while also changing a rolling last-10 window. To follow the remaining dates without freezing another static list, add the complete MLB schedule calendar. Recalculate only after the new results are final; never update recent form while leaving the season totals at an older cutoff.
Bottom Tier: Why the Athletics Rank Last
No. 30 is the Athletics as of the August 18 cutoff. They were last in season winning percentage at 49-77 and last in run differential at -179, a combination no recent-form adjustment could overcome. Their 4-6 last 10 was not the worst mark in baseball, but it offered too little separation to offset the two heavily weighted season components.
That answer is intentionally dated. MLB.com's August 5 contributor ranking and BetMGM's displayed August 11 update both listed the Angels last under their methods. This index uses later official results and fixed numeric weights. The different answers demonstrate why “worst team” should always travel with a date and methodology; they do not prove that an earlier writer made an error.
No. 29 San Francisco was 51-74 with a -74 margin and a 3-7 last 10. No. 28 Colorado had a slightly worse 50-76 record and a much worse -120 differential, but 5-5 recent form keeps the Rockies just above the Giants in this model. Change the form weight and those neighbors could reverse, which is another reason to read the component data.
No. 27 Seattle is the bottom tier's counterintuitive placement. The Mariners' 59-67 record and -45 margin were clearly better than several teams below and immediately above them. A 3-7 last 10, tied for the weakest recent input, creates a large enough penalty to drop Seattle behind the Angels and Royals. That does not erase its stronger season; it describes how sharply its current and season signals conflict.
No. 26 Los Angeles and No. 28 Colorado shared 50-76 records, but the Angels' -84 scoring margin was 36 runs better than the Rockies' -120. That distinction puts Los Angeles ahead. No. 25 Kansas City was 53-74 and -106 with neutral 5-5 form, a profile that remains weak across the season even without a current collapse.
No. 24 Cincinnati owned the best record in the tier at 60-66, but its -89 margin and 4-6 last 10 prevented a larger advantage. No. 23 New York had a worse 57-70 record yet a much better -44 margin and a 6-4 recent mark, placing the Mets first among this final group.
None of these placements measures farm systems, future payroll choices or whether a young roster can improve in 2027. They summarize major-league results through one date. For the Athletics, the last-place conclusion is unusually robust because both the record and margin components agree. It can still change only through new games—not through attaching a permanent label to an organization.
How to Use and Update the Rankings
A power ranking is most useful when its assumptions remain attached. Before quoting a team's position, verify the update date, completed-games cutoff and formula. This edition is fixed through August 18. A result on August 19 cannot be added casually because it changes more than one field: season winning percentage and run differential move, while the rolling last-10 window may drop an older game.
- Wait for final results. Do not mix an in-progress score into a table of completed games.
- Refresh every input together. Retrieve record, games played, differential and last-10 split from the same cutoff.
- Recalculate component ranks. One result can move several tied teams even when their own games have not changed.
- Record the new date. Preserve an older edition as a snapshot instead of silently replacing its date alone.
- Use matchup pages for decisions. Rank does not include that day's probable pitcher, venue or lineup availability.
For viewing plans, check the MLB TV schedule rather than assuming a highly ranked team is nationally televised. For broader schedule analysis and future ranking updates, browse the MLB Schedule blog. Those pages answer different questions: where and when a game is available, and what completed results mean.
Are MLB power rankings the same as the standings?
No. Standings are the official record of wins, losses and race position. Power rankings are editorial comparisons. MLB.com's own weekly list is compiled from contributor rankings; this article instead publishes a fixed numeric method. Neither system replaces official standings or league tiebreakers.
How often should power rankings be updated?
Weekly updates are usually frequent enough to show movement without overreacting to every game. An extra update after a major checkpoint can be useful, but only after a complete slate and synchronized data pull. There is no MLB rule requiring one editorial cadence. Whatever cadence is chosen, the visible cutoff matters more than the weekday.
Can a team with a losing record rank above a .500 team?
Yes, if the declared formula uses more than record. Detroit was 61-65 but ranked No. 14 because its +83 differential was seventh best and its last 10 was 5-5. Houston was 63-63 but ranked No. 17 with a -32 differential and 4-6 recent mark. The Tigers did not receive imaginary wins; their scoring margin and form outweighed Houston's record edge in this composite.
Do these rankings predict the World Series winner?
No. MLB notes that the team with the best run differential does not always win the World Series, and this index is even narrower than a playoff model. It does not simulate series, rotations, injuries or opponent paths. Milwaukee's No. 1 means the Brewers had the strongest combined results through the cutoff—not that an October outcome is settled.
The durable takeaway is method, not certainty. Keep the date beside the rank, compare the three signals and go back to current schedules once new games begin. That turns “best team right now” into a transparent, testable snapshot instead of a permanent slogan.
Loading comments...