
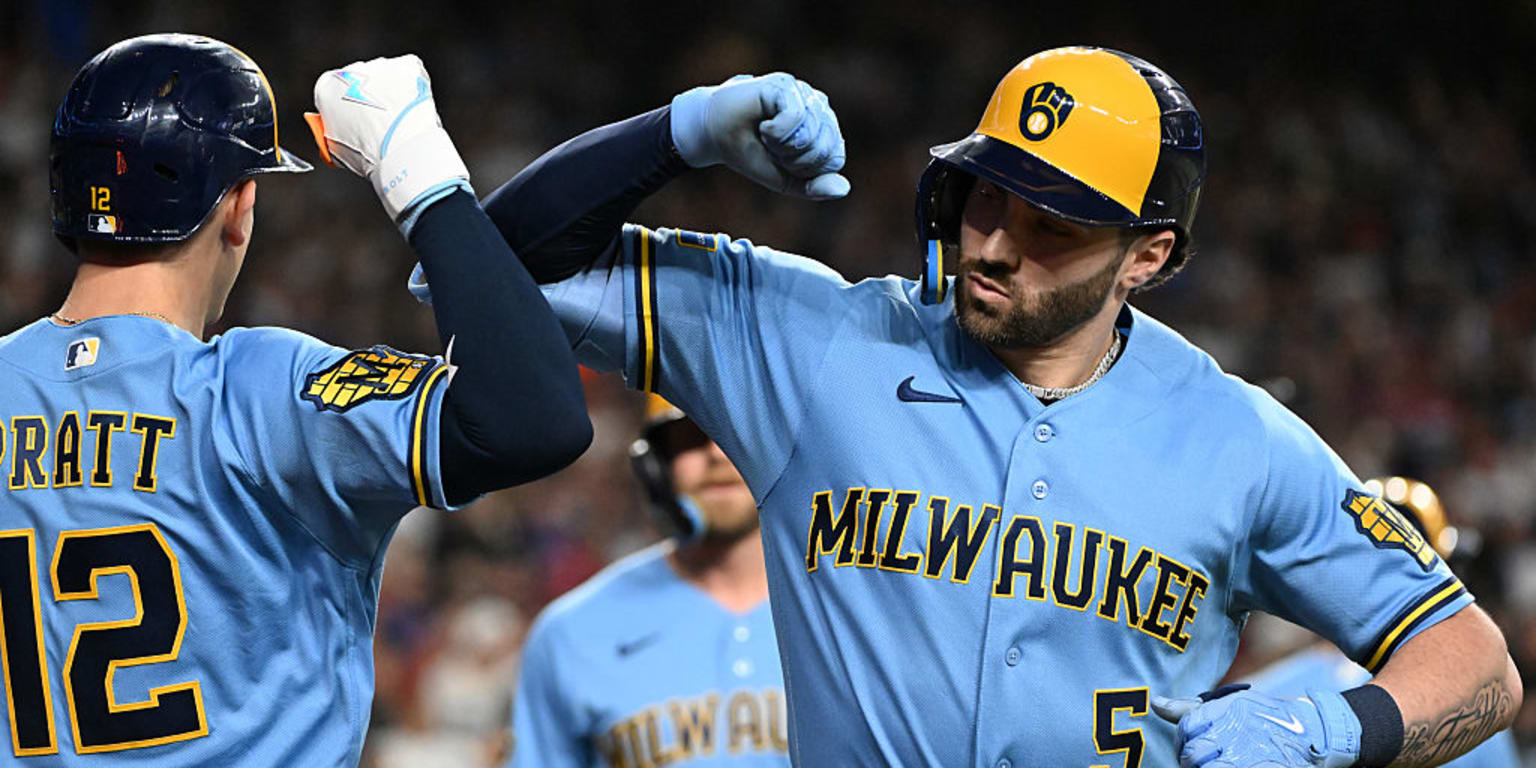
The Milwaukee Brewers owned MLB's best record at 87-53 (.621) through games completed September 2, 2026. That is the headline of this September 3 snapshot, which brings the leading club records, individual batting and pitching categories, and major team-stat leaders into one place.
Every figure below is an in-season total, not a final entry in the 2026 record book. Clubs had played different numbers of games at the cutoff, September results were still arriving, and a leader could change as soon as the next game became official. The fixed cutoff makes the tables internally consistent even when a live leaderboard has already moved.
The article separates winning percentage from subjective power rankings and actual totals from projected finishes. It also distinguishes counting categories, such as home runs and strikeouts, from rate categories, such as batting average and ERA, for which MLB applies qualification standards. Ties are retained rather than broken by an unrelated statistic.
Use this page to understand who was in front at one specific point in the stretch run. For results recorded after September 2, go directly to the live MLB standings. The sections that follow explain the cutoff, list the leaders, compare the closest races and show how much of the 162-game schedule remained without pretending the season had already ended.
How to Read This September 3 MLB Snapshot
The cutoff is more important than the page's publication date. “Through September 2” means a game counts only if it was completed by the end of that date's MLB schedule. A suspended or later game does not belong in these totals. The September 3 label tells readers when the snapshot was prepared; it does not mean that every September 3 game has already been played.
Team records are ordered by winning percentage, calculated from wins divided by total decisions. That avoids a misleading comparison when one club has played 139 games and another has played 140. Raw wins are still shown because they make the remaining-game math easy to check. Run differential is included as descriptive context, but it does not replace the official win-loss record.
Player categories require a second distinction. Home runs, RBI, runs, steals, strikeouts, wins and saves are counting statistics: every credited event adds to the total. Batting average, OPS, ERA and WHIP are rate statistics. Under MLB's normal qualification rules, a batter needs 3.1 plate appearances per scheduled league game for rate-stat leadership, while a pitcher needs one inning per scheduled league game for ERA. MLB applies that pitching threshold to WHIP and other rate leaderboards too.
When two players share a total, both remain leaders at this cutoff. This article does not invent a tiebreaker, and it does not use a close second-place value to call someone a co-leader. Finally, remember that official totals can move daily. Check today's MLB games and scores and the current standings before using this dated snapshot for a later matchup.
Best MLB Team Records Through September 2
Milwaukee held the No. 1 overall position at the cutoff, with Tampa Bay leading the American League and ranking second across MLB. The table sorts all clubs by exact winning percentage before displaying MLB's rounded three-decimal figure.
| Rank | Club | Games | Record | PCT | Run diff. |
|---|---|---|---|---|---|
| 1 | Milwaukee Brewers | 140 | 87-53 | .621 | +172 |
| 2 | Tampa Bay Rays | 139 | 83-56 | .597 | +51 |
| 3 | Atlanta Braves | 140 | 83-57 | .593 | +118 |
| 4 | Los Angeles Dodgers | 139 | 82-57 | .590 | +146 |
| 5 | New York Yankees | 140 | 80-60 | .571 | +115 |
| 6 | Philadelphia Phillies | 140 | 79-61 | .564 | +36 |
| 7 | Chicago Cubs | 140 | 78-62 | .557 | +132 |
| 8 | Boston Red Sox | 140 | 75-65 | .536 | +77 |
| 9 | Chicago White Sox | 139 | 73-66 | .525 | +43 |
| 10 | Arizona Diamondbacks | 141 | 74-67 | .525 | -1 |
The first lesson is that “best record” has a precise answer but not a permanent one. Milwaukee's .621 percentage led Tampa Bay's .597 by 24 percentage points in the displayed format. The Brewers also had the largest run differential in this group, yet the official standings position comes from wins and losses, not scoring margin.
The middle of the table shows why wins alone cannot set the order. Arizona had one more victory than the White Sox, but it had also played two more games. Chicago's 73 wins in 139 decisions produce a fractionally higher percentage than Arizona's 74 in 141, although both round to .525. That is a rounding tie on the screen, not an exact mathematical tie.
Run differential adds another layer without changing the record. The Cubs' +132 was larger than Tampa Bay's +51 even though Chicago trailed the Rays by five wins and 40 displayed percentage points. Arizona was above .500 with a -1 differential. Those contrasts describe how scoring and outcomes had accumulated; they do not prove which club would finish higher.
For how teams reached an earlier checkpoint, see the separate post-All-Star standings comparison. This table deliberately answers a different question: who owned the strongest actual records after every September 2 result was complete.
2026 MLB Batting Leaders
The batting leaderboard did not have one universal “best hitter.” Yordan Alvarez led the qualified average and OPS races, Kyle Schwarber led home runs, Sal Stewart led RBI, Pete Crow-Armstrong led runs, and Nasim Nuñez led stolen bases. Each category measures a different kind of production.
| Category | Leader | Total | Second place | Total |
|---|---|---|---|---|
| Home runs | Kyle Schwarber, PHI | 40 | Pete Crow-Armstrong, CHC | 38 |
| Batting average* | Yordan Alvarez, HOU | .317 | Luis Arraez, PHI | .315 |
| OPS* | Yordan Alvarez, HOU | 1.037 | Pete Crow-Armstrong, CHC | .943 |
| RBI | Sal Stewart, CIN | 105 | Alec Burleson, STL | 101 |
| Runs | Pete Crow-Armstrong, CHC | 102 | James Wood, WSH | 100 |
| Stolen bases | Nasim Nuñez, WSH | 44 | Jazz Chisholm Jr., NYY | 40 |
*Qualified MLB rate-stat leaderboard.
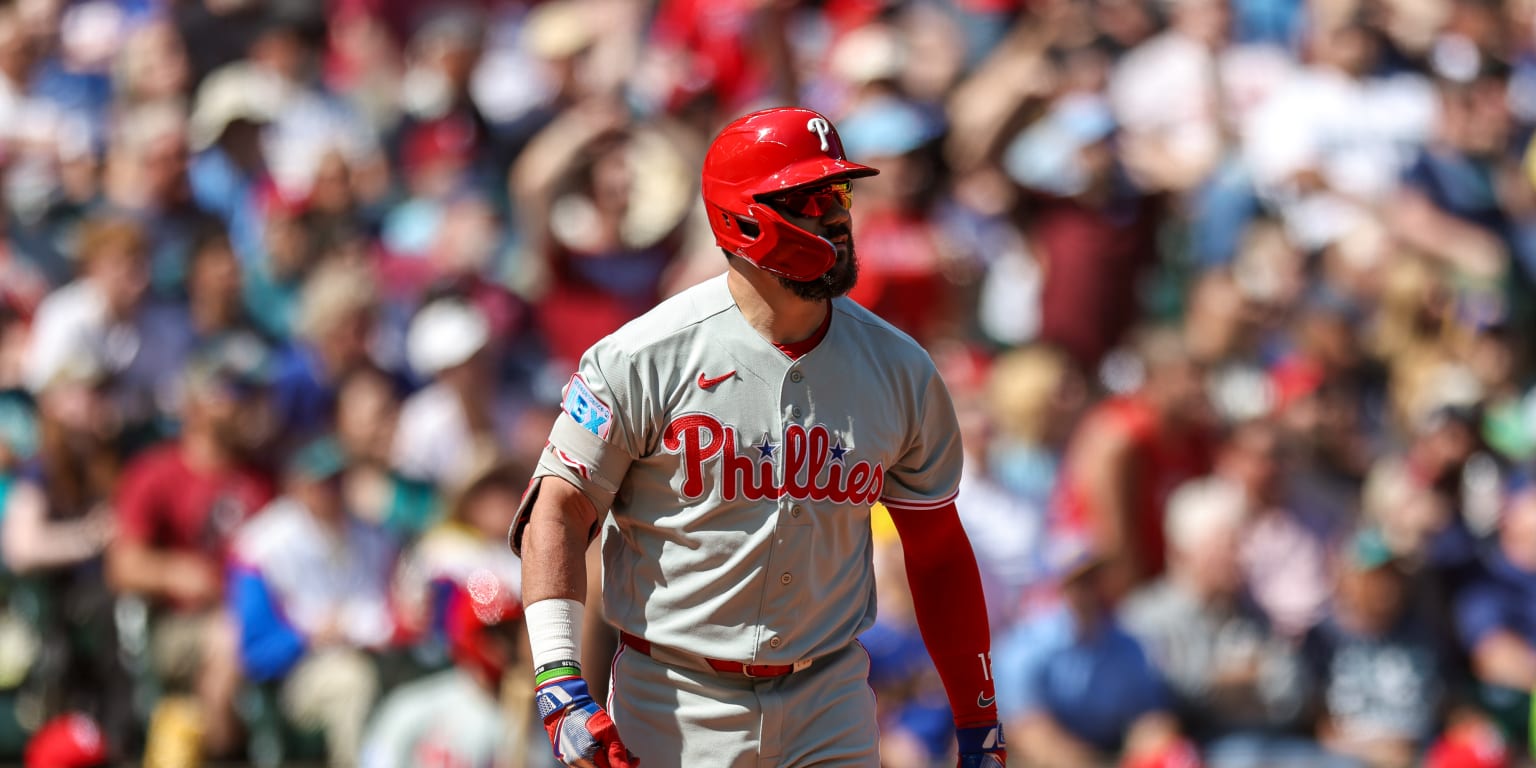
Schwarber's 40 homers put him two ahead of Crow-Armstrong. MLB had reported that Schwarber became the season's first player to reach 40 when he hit that home run on August 26; his total was still 40 at this cutoff. Three players—Alvarez, Junior Caminero and Matt Olson—were tied behind the top two with 37, so a compact “top three” home-run list actually contained five names.
Alvarez's two leads illustrate the difference between a hit rate and broader offensive value. His .317 average narrowly topped Arraez's .315, a gap of two points. His 1.037 OPS, which combines on-base and slugging percentages, was 94 points above Crow-Armstrong's .943. Both comparisons use qualified hitters, so a brilliant small sample cannot displace players who met MLB's playing-time standard.
The counting races were distributed across clubs and player types. Stewart's 105 RBI led Burleson by four, while Crow-Armstrong's 102 runs were two more than Wood's 100. Nuñez held a four-steal advantage over Chisholm. Those totals reward accumulated events, but opportunity and lineup context still matter: an RBI needs a runner to drive in, and a run usually needs teammates to extend the inning.
No row is an award ballot. It is a direct answer to who led that statistic at the cutoff. The close margins are revisited below only after the pitching and team categories receive the same dated treatment.
2026 MLB Pitching Leaders
Jacob Misiorowski appeared at the top of three major pitching lists: qualified ERA, qualified WHIP and strikeouts. The wins race had co-leaders, while Bryan Baker held the saves lead. As with the batting table, the rows describe separate achievements rather than one all-purpose ranking of pitchers.
| Category | Leader | Total | Next | Total |
|---|---|---|---|---|
| ERA* | Jacob Misiorowski, MIL | 1.97 | Cam Schlittler, NYY | 2.04 |
| WHIP* | Jacob Misiorowski, MIL | 0.79 | Yoshinobu Yamamoto, LAD | 0.90 |
| Strikeouts | Jacob Misiorowski, MIL | 227 | Dylan Cease, TOR | 221 |
| Wins | Sonny Gray, BOS / Cristopher Sánchez, PHI | 16 | Chase Burns, CIN / Foster Griffin, CLE | 15 |
| Saves | Bryan Baker, TB | 39 | Riley O'Brien, STL / Cade Smith, CLE | 35 |
*Qualified MLB rate-stat leaderboard; lower is better.
Misiorowski's 1.97 ERA was seven hundredths lower than Schlittler's 2.04. His 0.79 WHIP led Yamamoto's 0.90 by eleven hundredths, and his 227 strikeouts were six more than Cease's 221. ERA measures earned runs allowed per nine innings, while WHIP divides walks plus hits by innings pitched. The two rate stats overlap in their focus on prevention, but they do not count exactly the same events or assign them the same weight.
The wins row requires literal tie treatment. Gray and Sánchez each had 16, one ahead of Burns and Griffin at 15. A pitcher earns a win through pitcher-of-record rules when his club takes the lead for good, with additional requirements for a starter. The total therefore reflects both pitching and the game situation around that pitcher; it should not be read as a self-contained measure of quality.
Saves carry similar opportunity context. Baker had 39, while O'Brien and Smith shared second with 35. A reliever cannot record a save unless he finishes a team victory and meets one of the qualifying lead, tying-run or innings conditions. Clubs that create more eligible late leads can create more save chances. Total saves answer how many were credited, not how often every closer succeeded when given an opportunity.
Finally, the ERA and WHIP rows include qualified pitchers. Relievers with fewer innings can post lower raw rates without appearing here because they have not carried the workload required for the overall leaderboard. Keeping that label visible prevents a common search-result mistake: comparing a qualified starter's full-season rate with an unqualified short relief sample.
Team Offense Leaders Tell Different Stories
Chicago led three of the four team categories selected for this snapshot. Washington led stolen bases and sat second in both runs and home runs. That combination shows why “best offense” should name the statistic being compared instead of collapsing every result into one vague label.
| Category | Leader | Total | Second place | Total |
|---|---|---|---|---|
| Runs | Chicago Cubs | 751 | Washington Nationals | 735 |
| Home runs | Chicago Cubs | 197 | Washington Nationals | 193 |
| OPS | Chicago Cubs | .772 | Los Angeles Dodgers | .758 |
| Stolen bases | Washington Nationals | 151 | Miami Marlins | 146 |
The Cubs' 751 runs came across 140 games, or about 5.36 per game. Washington scored 735 in 142, about 5.18 per game. Showing both totals and games played prevents a cumulative lead from being mistaken for an equal-schedule comparison. Chicago also held narrow counting leads of 16 runs and four home runs, so those columns were much closer than the raw rank numbers might suggest.
OPS adds a rate-style team view by combining on-base and slugging percentages. Chicago's .772 led the Dodgers' .758, while Washington ranked third at .754. The Nationals nevertheless occupied the top stolen-base spot with 151, five ahead of Miami. Those columns describe different paths to advancing and scoring runners: reaching base and hitting for power are captured in OPS, while steals record successful advances during plate appearances by teammates.
None of this overrides the standings. Washington's offensive totals can be impressive even when another club owns a better win-loss record, because winning also depends on runs allowed and on how scoring is distributed across games. Likewise, a club can lead a counting statistic partly because it has played more often. Consult the complete MLB schedule to see the dates behind unequal games played, then use the pitching and run-prevention figures next to build a fuller team picture.
Team Pitching and Run Prevention Leaders
No single staff led every pitching category. The Yankees had the lowest ERA and allowed the fewest total runs, Tampa Bay posted the lowest WHIP, Philadelphia recorded the most strikeouts, and Milwaukee owned the largest run differential. The table keeps those definitions separate.
| Category | Leader | Value | Second place | Value |
|---|---|---|---|---|
| ERA | New York Yankees | 3.24 | Milwaukee Brewers | 3.48 |
| WHIP | Tampa Bay Rays | 1.15 | Los Angeles Dodgers | 1.16 |
| Strikeouts | Philadelphia Phillies | 1,374 | Milwaukee Brewers | 1,340 |
| Fewest runs allowed | New York Yankees | 521 | Milwaukee Brewers | 532 |
| Run differential | Milwaukee Brewers | +172 | Los Angeles Dodgers | +146 |
ERA and total runs allowed are related but not identical. ERA excludes runs classified as unearned and scales earned runs to nine innings. The runs-allowed column counts every opponent run. New York led both views at the cutoff, with a 3.24 ERA and 521 runs allowed; Milwaukee followed at 3.48 and 532.
WHIP narrows the question to walks and hits allowed per inning. Tampa Bay's 1.15 barely led the Dodgers' 1.16. That one-hundredth gap says the race was close, but WHIP does not distinguish a single from a home run and does not include every route to base. It is useful evidence, not a complete account of a staff.
Philadelphia's 1,374 strikeouts were 34 more than Milwaukee's 1,340. Strikeouts remove the uncertainty of a ball in play, yet a high total also depends on innings and opportunities. It is therefore possible to lead strikeouts without leading ERA, WHIP or runs allowed, exactly as this table demonstrates.
Run differential widens the lens because it subtracts runs allowed from runs scored. Milwaukee's +172 led the Dodgers' +146 and Chicago's +132. That helps explain why the Brewers could combine the best record with strong offense and prevention, but it remains an accumulated margin, not a promise about the next game or final standings.
Which Leader Races Were Still Closest?
The wins leaderboard was already tied, and three prominent batting races had very small first-to-second margins. These are scoreboard gaps at the cutoff, not forecasts about who will lead on September 27.
| Category | Leader(s) | Nearest chaser | Gap |
|---|---|---|---|
| Pitcher wins | Sonny Gray / Cristopher Sánchez, 16 | Co-leaders | 0 |
| Home runs | Kyle Schwarber, 40 | Pete Crow-Armstrong, 38 | 2 |
| Runs | Pete Crow-Armstrong, 102 | James Wood, 100 | 2 |
| Batting average* | Yordan Alvarez, .317 | Luis Arraez, .315 | .002 |
| ERA* | Jacob Misiorowski, 1.97 | Cam Schlittler, 2.04 | .07 |
*Qualified rate-stat leaderboard; lower is better for ERA.
A tie in wins is literal: Gray and Sánchez had each been credited with 16. The next group, Burns and Griffin at 15, was one win behind both co-leaders. Future starts might create opportunities, but the official pitcher-of-record decision—not merely innings quality—determines whether a win is added.
The two-counting-stat gaps are equally easy to read. Schwarber led Crow-Armstrong by two home runs, and Crow-Armstrong led Wood by two runs. Other counting gaps were slightly wider: four separated first from second in RBI and steals, four separated Baker from the two pitchers tied for second in saves, and six separated Misiorowski from Cease in strikeouts.
Rate gaps behave differently. Alvarez's .317 average was two batting-average points above Arraez's .315, while Misiorowski's 1.97 ERA was seven hundredths lower than Schlittler's 2.04. Each new at-bat or inning changes both a numerator and a denominator, so a rate can rise or fall without a fixed number of events “needed” to take the lead.
For that reason, this table does not rank the races by drama. A gap of .002, two homers and two runs use incomparable units. It simply identifies where the official leaderboards were tightly grouped when the snapshot froze.
How Much of the 2026 MLB Season Was Left?
The published regular-season schedule ends Sunday, September 27, 2026. MLB scheduled all 15 games on that final day to begin between 3:00 and 3:20 p.m. ET, concentrating the closing results into one afternoon. At the September 2 cutoff, however, clubs had not all completed the same number of games.
| Club | Games played | Calculation | Games remaining |
|---|---|---|---|
| Tampa Bay Rays | 139 | 162 − 139 | 23 |
| Milwaukee Brewers | 140 | 162 − 140 | 22 |
| Arizona Diamondbacks | 141 | 162 − 141 | 21 |
| Washington Nationals | 142 | 162 − 142 | 20 |
Across MLB, the games-played range was 139 to 142, so the simple 162-game calculation produced a range of 23 to 20 remaining. Those are scheduled games, not calendar days. Off days and series arrangements mean a club with 22 games left does not play on every date before September 27.
The difference also explains why counting totals require care. A player on a club with 23 games remaining may have a different maximum number of team opportunities than a player on a club with 20. Individual playing time, batting order, rotation turns and game situations then narrow those opportunities further. The remaining-game column is context, not a projection of added homers, wins or strikeouts.
Postponements and other official adjustments can move a specific game or time, so a preseason schedule document should not be treated as the final operational word. Use the current full MLB schedule for the latest dates and the tomorrow schedule for the next slate. That is the reliable way to move forward from this frozen statistical checkpoint.
2026 MLB Records and Leaders FAQ
Is this the final 2026 MLB leaderboard?
No. This is an in-season snapshot prepared September 3 from games completed through September 2. The published regular-season schedule continues through September 27, so every leader still had scheduled opportunities remaining. Final single-season records can be discussed only after the relevant games and official statistical decisions are complete. For finished historical comparisons, use the best and worst 162-game-era records guide.
Who had the best record in MLB at this cutoff?
The Milwaukee Brewers, at 87-53 (.621). Tampa Bay was second overall at 83-56 (.597), followed by Atlanta at 83-57 (.593) and the Dodgers at 82-57 (.590). Those positions answer the question only through September 2. The live MLB standings should be used for any game completed afterward.
Why might another page show different 2026 leaders?
First compare cutoffs. A live page can include a September 3 result that this snapshot deliberately excludes. Next compare filters: qualified versus all players, MLB versus one league, regular season versus postseason, and counting total versus rate can produce different lists. Official scoring changes can also revise a total after a game. A dated page is useful only when its date, competition and qualification settings stay attached to the number.
Are these actual totals or projected final standings?
They are actual credited totals at the cutoff. No record, home-run total, ERA or other figure has been extrapolated to 162 games. A projection estimates possible future outcomes using assumptions and probabilities; it is a different product. Read the 2026 projected standings explainer when that is the question you mean to ask.
Does leading a statistic guarantee an award or playoff seed?
No. BBWAA voters select the major league-specific MVP, Cy Young, Rookie of the Year and Manager of the Year awards after considering regular-season performance; a single category does not automatically cast those ballots. Team postseason seeds come from the standings and division/Wild Card structure, not from an individual player leaderboard. The MLB playoff format guide explains how division winners, Wild Cards and first-round byes fit together.
Loading comments...