
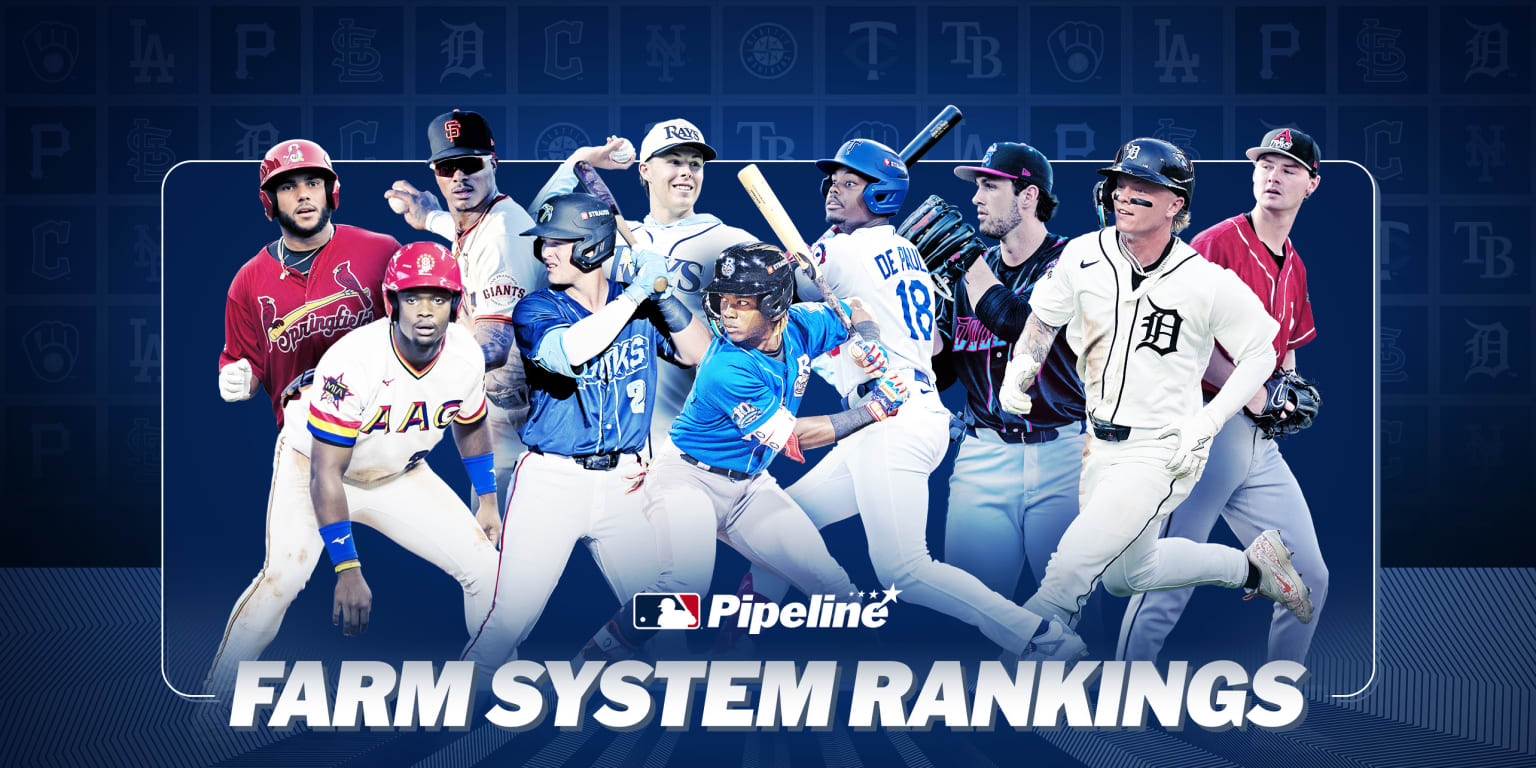
The latest fully published 2026 MLB farm system order from MLB Pipeline is its August 16 in-season ranking: the Los Angeles Dodgers are No. 1, followed by the Tampa Bay Rays and Milwaukee Brewers. This guide reports that specific, dated list. It is not an independent MLBSchedule.net ranking, and it should not be mixed with a preseason list or a live model without checking when each one was updated.
Timing matters more here than it does with many baseball lists. The 2026 Draft added an entire class of prospects, the Trade Deadline moved young talent between organizations, and Major League promotions removed players who exhausted prospect eligibility. A useful ranking therefore needs a clear publisher and cutoff, not just a number beside each club.
What Are the Latest 2026 MLB Farm System Rankings?
For a current post-Draft, post-deadline snapshot, this article uses MLB Pipeline’s ranking published August 16, 2026. Pipeline released it after refreshing its Top 100 prospects, all 30 team Top 30 lists and its positional rankings. Its separate August 13 update says those evaluations incorporated the Draft, Trade Deadline and most of the 2026 season.
That scope makes the list more useful for a September reader than an “entering 2026” ranking. The Dodgers rose from second in Pipeline’s preseason order to first. Tampa Bay climbed from tenth to second, while preseason leader Milwaukee moved to third. Those shifts do not necessarily mean one organization suddenly learned or forgot how to develop players. The available prospect pool changed, and the information used to evaluate that pool changed with it.
A farm-system ranking measures the talent that remains in an organization’s prospect pipeline. It is not a ranking of the current Major League roster, a prediction of tonight’s winner or a promise that a prospect will become a star. A contender can rank low after promoting productive rookies or trading prospects for veterans. A rebuilding club can climb rapidly after adding draft picks and trade returns even though its MLB record remains poor.
For that reason, keep this list separate from the site’s 2026 MLB power rankings, which evaluate present Major League strength. The table below answers the farm-system question using one consistent source and shows each club’s movement from Pipeline’s own preseason list. Later sections explain what drove the largest changes and why Baseball America, FanGraphs and ESPN can reach different conclusions without any one list being mislabeled.
All 30 MLB Farm Systems Ranked
The table is MLB Pipeline’s published order as of August 16, 2026. “Preseason” is the organization’s position in Pipeline’s own preseason ranking, while “change” is a simple comparison between those two lists. A plus sign means the club moved closer to No. 1; a minus sign means it moved down. It is not a change in a score, because Pipeline does not publish a single overall point total for this farm-system list.
| Rank | Organization | Preseason | Change |
|---|---|---|---|
| 1 | Los Angeles Dodgers | 2 | +1 |
| 2 | Tampa Bay Rays | 10 | +8 |
| 3 | Milwaukee Brewers | 1 | -2 |
| 4 | St. Louis Cardinals | 4 | 0 |
| 5 | San Francisco Giants | 19 | +14 |
| 6 | Washington Nationals | 17 | +11 |
| 7 | Baltimore Orioles | 13 | +6 |
| 8 | Detroit Tigers | 5 | -3 |
| 9 | Seattle Mariners | 8 | -1 |
| 10 | Miami Marlins | 11 | +1 |
| 11 | Minnesota Twins | 9 | -2 |
| 12 | Cleveland Guardians | 6 | -6 |
| 13 | Pittsburgh Pirates | 3 | -10 |
| 14 | Athletics | 18 | +4 |
| 15 | Chicago White Sox | 16 | +1 |
| 16 | Colorado Rockies | 27 | +11 |
| 17 | Los Angeles Angels | 28 | +11 |
| 18 | New York Mets | 7 | -11 |
| 19 | Kansas City Royals | 21 | +2 |
| 20 | Texas Rangers | 25 | +5 |
| 21 | Atlanta Braves | 24 | +3 |
| 22 | Toronto Blue Jays | 15 | -7 |
| 23 | Cincinnati Reds | 12 | -11 |
| 24 | Boston Red Sox | 14 | -10 |
| 25 | Arizona Diamondbacks | 22 | -3 |
| 26 | Philadelphia Phillies | 20 | -6 |
| 27 | New York Yankees | 26 | -1 |
| 28 | Chicago Cubs | 23 | -5 |
| 29 | Houston Astros | 29 | 0 |
| 30 | San Diego Padres | 30 | 0 |
Editorial note: one sentence in Pipeline’s introduction says San Francisco rose to No. 4. The same page’s top-five sentence, numbered entry and Giants analysis all place the club at No. 5, so this table follows the published numbered list.
The most striking feature is movement, not just the team at the top. Eight organizations shifted by at least ten places. San Francisco made the largest jump, while Washington, Colorado and the Angels also climbed eleven or more. The Mets and Reds fell eleven positions; Pittsburgh and Boston dropped ten. That degree of churn is a reminder that preseason and in-season rankings answer questions about different prospect populations.
The top ten also are not a single type of farm. Some clubs combine several nationally ranked prospects with depth well beyond the headline names. Others have improved quickly because new draftees, trade returns or breakouts changed the upper part of their lists. St. Louis stayed fourth, which looks quiet beside the Giants’ jump but still represents a top-tier result. Seattle slipped only one place and remained ninth despite considerable turnover.
Likewise, “middle of the table” does not mean an organization lacks valuable players, and No. 30 does not mean every prospect is weak. This is a relative ordering of 30 changing inventories. A single elite prospect, a deep group of plausible contributors and a balanced mix of hitters and pitchers can be weighted differently. The next sections explain the current leaders and the biggest movers without treating one ordinal place as a permanent verdict.
Why the Dodgers, Rays and Brewers Lead the List
The top three illustrate three ways to build an elite farm: concentrate several highly ranked prospects near the top, maintain credible depth after trades, and keep replacing players who graduate. MLB Pipeline’s order reflects more than a count of famous names, but its updated Top 100 gives a useful starting point for understanding the leaders.
1. Los Angeles Dodgers
Los Angeles has six players in Pipeline’s August Top 100: Josue De Paula at No. 6, Mike Sirota at No. 16, Eduardo Quintero at No. 20, Emil Morales at No. 24, Christian Zazueta at No. 36 and Charles Davalan at No. 87. Four top-24 players give the system unusual concentration near the front of the national list. Just as important, Pipeline still saw enough talent behind them to rank the complete organization first.
The deadline tested that depth. The Dodgers sent Zyhir Hope, River Ryan and Brady Smith to Detroit, with Hope and Ryan also appearing in the refreshed Top 100. Remaining No. 1 after losing that package is evidence of the inventory that was already in place; it is not proof that the departures carried little value. Los Angeles moved up one spot from the preseason list.
2. Tampa Bay Rays
Tampa Bay’s move from tenth to second begins with two top-12 prospects: 2026 No. 2 overall draft pick Grady Emerson at No. 10 and Theo Gillen at No. 12. Caden Bodine, Nathan Flewelling and Cooper Flemming give the Rays five Top 100 players in total. Pipeline also cited progress from players outside that group, which helps explain why the overall system position is stronger than a headline-only view.
The Rays’ jump also shows how quickly a draft selection and new performance information can change a snapshot. It does not mean that every eighth-place gain came from Emerson, or that the same five prospects will occupy the same ranks next spring. The in-season list is a refreshed evaluation of the organization as it stood in August.
3. Milwaukee Brewers
Milwaukee slipped from first to third but still owns the No. 1 overall prospect on Pipeline’s list, shortstop Jesús Made. Luis Peña is No. 21, followed by Josh Adamczewski, Luis Lara and Brady Ebel near the back of the Top 100. That is a valuable high-end anchor plus several additional nationally ranked players. The Brewers also remained near the top after Cooper Pratt, Brandon Sproat and Logan Henderson graduated, an important sign that the system was not dependent on one departing class.
Pipeline’s August Top 100 article offers another lens called Prospect Points: No. 1 receives 100 points, No. 2 receives 99, continuing down to one point for No. 100. The Dodgers led at 417, the Rays had 284 and the Brewers had 207. Yet Seattle scored 369 and ranked ninth in the separate farm-system order. That gap is the clearest warning not to treat Prospect Points as the unpublished formula for the all-30 ranking. Points describe high-end placement; a full-system evaluation can also consider depth and the shape of the organization beyond the Top 100.
The Biggest Farm System Risers in 2026
The largest gains came from a mix of new acquisitions and changed evaluations. A draft pick enters the inventory immediately, a deadline seller can receive several prospects at once, and a player already in the system can improve enough to move onto a national list. Pipeline’s preseason-to-August comparison captures all three forces, so “up eleven” should not be read as a single transaction grade.
- San Francisco Giants: 19th to 5th (+14). San Francisco made the biggest leap. Its established group of young position players was joined by a substantial wave of pitchers. No. 4 overall draft pick Jackson Flora and deadline acquisition Ramon Marquez both entered Pipeline’s Top 100, while other July additions expanded the team list. The result was five Top 100 prospects and a more balanced top tier. MLB’s August Giants prospect update documents that influx separately from the all-30 ranking.
- Washington Nationals: 17th to 6th (+11). Washington’s rise combines a premium headliner with added pitching depth. Eli Willits sits fourth on Pipeline’s Top 100. Jack Cebert, Ben Grable and Yovanny Cruz joined the organization in the Luis García Jr. trade, while Travis Sykora, Jarlin Susana and Seaver King remained nationally ranked. A jump this large therefore reflects more than one new name.
- Colorado Rockies: 27th to 16th (+11). Colorado placed four prospects in the updated Top 100. Ethan Holliday led that group at No. 25, while 2026 first-rounder Tyler Bell debuted at No. 64. Roldy Brito’s climb to High-A as a teenager and a better 2026 showing from Charlie Condon added information that was unavailable at the preseason cutoff.
- Los Angeles Angels: 28th to 17th (+11). The Angels acquired No. 38 prospect Arjun Nimmala in the José Soriano trade. Right-hander Tyler Bremner reached Double-A and ranked No. 46, while additional lower-level performances strengthened the team’s Top 30. Seventeenth is not an elite-system label, but moving into the middle of the table is meaningful for a club that started near the bottom.
- Tampa Bay Rays: 10th to 2nd (+8). Drafting Grady Emerson second overall immediately added Pipeline’s No. 10 prospect. Theo Gillen moved to No. 12, three other Rays made the Top 100 and several players outside it improved their standing. Tampa Bay’s case is useful because a prominent draft addition and organic development both contributed to the same rise.
- Baltimore Orioles: 13th to 7th (+6). Seventh overall pick Eric Booth Jr. entered at No. 40, and Anthony Eyanson arrived in the trade that sent Adley Rutschman to Boston. Joseph Dzierwa and Caden Hunter reached Double-A and joined the Top 100 through their 2026 performance. Baltimore illustrates how a seller’s return, a high draft pick and internal progress can reinforce one another.
These improvements are encouraging evaluations, not completed development stories. Newly drafted teenagers may be years from MLB, trade returns still carry risk, and a Top 100 place can move with performance, health or new scouting information. The fairest takeaway is that these organizations held more highly regarded prospect talent at the August snapshot than they did when Pipeline published its preseason order.
Why Strong Systems Can Fall After Graduations and Trades
A drop in farm rank is not one diagnosis. It can mean prospects reached MLB, a contender exchanged future talent for present help, injuries reduced the current pool, or evaluations moved in the wrong direction. The same ten-place fall can therefore describe very different organizational outcomes.
Productive depletion: prospects graduate
The Pirates fell from third to 13th after Konnor Griffin and Bubba Chandler graduated from prospect status. Removing two players who had anchored the preseason group changes the inventory, even though promotion is exactly what a farm system is designed to achieve. Pittsburgh still placed four players in the updated Top 100, including No. 7 Seth Hernandez, so the ten-place decline does not mean the pipeline became empty.
Cincinnati’s move from 12th to 23rd followed a similar pattern. Sal Stewart and Rhett Lowder began the year in Pipeline’s Top 100 and graduated, while Edwin Arroyo returned to the national list during the season before graduating as well. Cleveland slipped from sixth to 12th after Travis Bazzana, Chase DeLauter and Parker Messick moved into Major League roles. Those names no longer add farm value, but their arrival in Cleveland is evidence of output from the system.
The Mets had the largest mixed example, dropping from seventh to 18th. Nolan McLean, Carson Benge and A.J. Ewing graduated. New York did acquire Jefferson Rojas from the Cubs before the deadline, but he was the organization’s only player on Pipeline’s updated Top 100, at No. 76. The farm rank fell because the outgoing prospect-eligible value was greater than the value added to the current list.
Transaction depletion: prospects buy MLB help
Boston moved from 14th to 24th after both promotions and a major trade. Payton Tolle, Connelly Early and Jake Bennett graduated, while Anthony Eyanson, Kyson Witherspoon and Enddy Azocar went to Baltimore in the deal for Adley Rutschman. Franklin Arias remained an elite individual prospect at No. 3, but one exceptional player does not by itself preserve the depth of an entire organization.
That trade also demonstrates why rankings are linked across clubs. The same young players subtracted from Boston helped Baltimore climb. Farm movement is not a league-wide report card with equal gains available to every team; deadline deals literally transfer prospect value from one column to another. Whether that exchange was worthwhile depends on the Major League return, the competitive window and what the prospects eventually become—questions an August farm ranking cannot settle.
Injuries and thinner depth
Toronto fell seven places to 22nd after Trey Yesavage graduated, Arjun Nimmala was traded to the Angels and injuries limited Ricky Tiedemann and Jake Bloss. Philadelphia dropped six spots to 26th after Andrew Painter and Justin Crawford graduated, while Aidan Miller had not played because of a back injury. These cases mix normal turnover with availability risk.
The useful distinction is between successful graduation, deliberate prospect spending and erosion without an MLB payoff. Rank movement alone cannot tell readers which occurred. Check the names leaving the eligible pool and where they went before treating any decline as bad news.
MLB Pipeline vs. Baseball America, FanGraphs and ESPN
There is no official league-wide formula that every prospect outlet must use. Each publisher starts with its own player evaluations, decides how much an elite prospect is worth relative to depth, and removes graduates according to its snapshot. The date can matter as much as the method. A January list cannot include a July draft class or August deadline returns.
| Publisher | Update used here | What the method emphasizes | Timing note |
|---|---|---|---|
| MLB Pipeline | August 16 | Editorial organization order informed by refreshed Top 100 and team Top 30 evaluations | Fixed post-Draft, post-deadline snapshot |
| Baseball America | August 12 | Talent ranking explicitly weighted toward high-end prospects | Players prospect-eligible on August 12 |
| FanGraphs | Live Board; new method introduced July 2 | Future Value grades converted into modeled surplus value, team-control WAR and star odds | Changes as grades and eligibility change |
| ESPN | January 29 | Kiley McDaniel’s player evaluations mapped to empirical surplus-dollar values by FV tier | Preseason snapshot |
MLB Pipeline: the dated order in this article
Pipeline published the all-30 table after updating its national and team lists. It also publishes Prospect Points for Top 100 placement, but its farm-ranking article does not present those points as a complete scoring formula. That is why this article reports Pipeline’s actual numbered order rather than trying to recreate it from a different table.
Baseball America: more weight near the top
Baseball America’s August 12 update states both its eligibility date and its preference for top-tier talent over bundles of lower-ranked prospects. It placed Tampa Bay first, whereas Pipeline placed the Dodgers first four days later. That disagreement is not a clerical problem. Different player lists and weighting choices can produce different leaders.
FanGraphs: a model that makes depth visible
FanGraphs took the most explicitly quantitative approach of this group. Its July 2026 valuation update uses historical outcomes to estimate surplus value, WAR under team control and the chance of star-level production for each Future Value tier. It also models value below the usual Top 100 boundary, which can reward a deep system differently from a method dominated by elite names.
There is another important distinction: FanGraphs says its Board updates in real time as its prospect staff changes grades and players graduate. “July 2” identifies the new methodology’s publication, not a frozen roster forever. A reader comparing it with Pipeline should note the day the Board was viewed, not merely the year in the heading.
ESPN: useful methodology, stale current order
ESPN’s January 29 ranking also assigns surplus-dollar values based on McDaniel’s player lists and FV tiers. It is transparent and useful as a preseason baseline, but it predates the 2026 Draft, most graduations and the deadline. Calling it the current post-deadline ranking would erase the very events that reshaped the systems.
A composite average would suggest false comparability: one input is preseason, one is live, and the others use different eligibility and weighting rules. The better practice is to name the publisher, method and date, then use that list consistently for the question being answered.
How to Use Farm Rankings Without Overreading Them
A farm ranking is most useful as a map of organizational prospect value at a moment in time. It is much less useful as a forecast with a guaranteed finish. Use the following checks before turning one ordinal number into a conclusion about a club’s future.
- Write down the publisher and date. “No. 6” has little meaning without the list that produced it. A fixed August Pipeline ranking, a live FanGraphs Board and a January ESPN table can all be labeled 2026 while describing different inventories.
- Check prospect eligibility. MLB’s rookie eligibility glossary uses thresholds of 130 Major League at-bats, 50 Major League innings or 45 active-roster days in previous championship seasons, excluding Injured List time from the days calculation. Pipeline requires rookie eligibility for its prospect lists. A player can therefore disappear from a farm ranking because he crossed a rule threshold, not because his talent vanished.
- Separate ceiling from depth. One top-five prospect can drive substantial value, while ten lower-ranked players create more paths to useful Major League contributors. Before comparing two neighboring teams, ask whether the publisher rewards the best player, the top five, the entire graded list or a modeled total.
- Separate ceiling from proximity. A gifted Single-A teenager may carry more long-term upside than a Triple-A player who is nearly ready to fill a bench role. The site’s MLB farm system levels guide explains the Single-A-to-Triple-A ladder, but a higher assignment does not automatically mean a higher prospect grade.
- Look for concentration of risk. Pitching health, defensive home, contact quality and distance from MLB all affect the range of possible outcomes. A system built around two injured pitchers has a different risk profile from one with similar estimated value spread across several healthy position players. No simple adjustment fits every case.
- Keep farm value separate from current wins. A deadline buyer may improve its MLB roster while lowering its farm rank. A seller can do the opposite. For the current race, use the 2026 projected standings; for who is actually playing, use the MLB games today page. Neither question is answered by a prospect list.
Even a numerical model contains judgment. Player grades are evaluations, historical comparisons require chosen samples, and future value depends on assumptions about development and time. FanGraphs’ own sensitivity analysis varies those assumptions rather than treating one estimate as certain. Editorial lists contain uncertainty too, even when they do not show it as a dollar range.
The best reading is directional: identify where talent is concentrated, what changed since the prior update and which players might affect the next wave of roster decisions. Then revisit the ranking after the next major wave of graduations, trades and new evaluations instead of treating August 16 as a permanent organizational label.
2026 MLB Farm System Rankings FAQ
Which MLB team has the No. 1 farm system in 2026?
The Los Angeles Dodgers are No. 1 in MLB Pipeline’s in-season ranking published August 16, 2026. That answer is specific to Pipeline’s release and date. Baseball America led its August 12 list with Tampa Bay, which is why a responsible answer always names the publisher instead of claiming one undisputed industry order.
Why do MLB farm system rankings disagree?
They disagree because prospect evaluation is not a single standardized calculation. Publishers grade players differently, choose different eligibility dates and place different weight on elite talent, lower-level depth, proximity, risk and projected value. A live database can also move between the publication dates of two fixed articles.
Does a low farm system ranking mean an organization is bad?
No, not by itself. A club can rank low after graduating prospects into a productive MLB roster or trading them for established players during a competitive window. A low rank can still warn that fewer replacements or trade assets remain, so the cause of the depletion matters more than the number alone.
Why does a team fall after promoting top prospects?
Graduated players stop counting in the eligible prospect pool. Their Major League contribution may improve the organization even while their removal lowers its farm rank. Pittsburgh’s 2026 fall after Konnor Griffin and Bubba Chandler graduated is a clear example of the ranking declining as the development pipeline delivers players upward.
How often are MLB farm system rankings updated?
There is no universal update schedule. MLB Pipeline published its 2026 preseason organization ranking on March 6 and its full in-season version on August 16. Pipeline also made smaller Top 100 and team-list corrections between those releases. FanGraphs describes its Board as real time, so its farm order can change whenever grades or eligibility change.
Do farm system rankings predict the World Series?
No. They evaluate prospect inventory, not the complete active roster or the path through October. Current Major League performance, injuries, trades, schedule strength and short-series variance matter far more to a World Series outcome. Farm strength may support a club over several seasons, but it is neither a playoff berth nor a championship probability.
Last reviewed September 3, 2026. The numbered table remains tied to MLB Pipeline’s August 16 publication so readers can compare the same fixed snapshot.
Loading comments...