
MLB win probability estimates a team's chance of winning one game from its current situation. A live graph helps explain how that position changes, while Win Probability Added, or WPA, describes the change associated with an event. Neither is the same thing as a playoff forecast or a guaranteed result.
To read one well, identify the team, the last completed play and the game state before studying the percentage. This guide explains the labels, works through clearly hypothetical calculations and shows where model assumptions can change the interpretation. It provides an explanation of the numbers, rather than a live probability feed for today's games.
What MLB win probability actually measures
A win probability describes a team's estimated chance of finishing a particular game as the winner from a particular moment. MLB calls that idea win expectancy. The useful question is therefore specific: given the situation now, how often does a comparable team eventually win? It is different from asking which club has the better roster, who deserves the victory or who will reach October.
Imagine an illustrative group of one hundred comparable situations in which the team under discussion eventually won seventy times. A seventy percent estimate would summarize that pattern. The remaining thirty outcomes still belong in the explanation. Losing from such a position is an outcome the estimate allows, rather than proof that the display promised the wrong winner. This example explains a percentage; it is not a newly calculated probability for any current matchup.
The state needs more detail than the score. A two-run lead in the second inning leaves many more opportunities for a comeback than the same lead with two outs in the ninth. Runners and outs also change the possibilities even when no run has scored. That is why the next out can move the line, and why a walk can make a close game feel different before the scoreboard changes.
Treat the percentage as a description attached to a state, not a label permanently attached to a team. A club can move from favorite to underdog and back within one inning. Before interpreting any number, find the correct matchup in the MLB games listing, check whether it is live or final and note the last completed play. A rounded display near zero or one hundred during play should never replace the actual game status.
Read a live chart in the right order
Start with the labels, then read the movement. A line can look alarming simply because you assumed it belonged to the other club. Providers can emphasize the home team, the batting team or a selected team. Baseball Savant's Game Strategy Explorer, for example, lets readers choose a home-team or batting-team perspective. That setting changes how you should interpret the number beside the same situation.
Identify the team and the last completed play
Match the team name or logo to the displayed percentage. Next, look at the final point rather than the most memorable peak earlier in the game. A high point in the fifth inning describes the fifth inning; it does not survive a later rally. Hover or select a point when the particular chart supports that interaction, and connect it to the corresponding play description.
A broadcast, radio feed and data page can reach you at different moments. If the screen shows a walk while the chart still reflects the preceding out, wait for both to describe the same completed play before drawing a conclusion. For help finding a matchup and its play sequence, use our MLB Gameday guide. An old tab, wrong date or second game of a doubleheader can otherwise create a misleading comparison.
Match the percentage to the game state
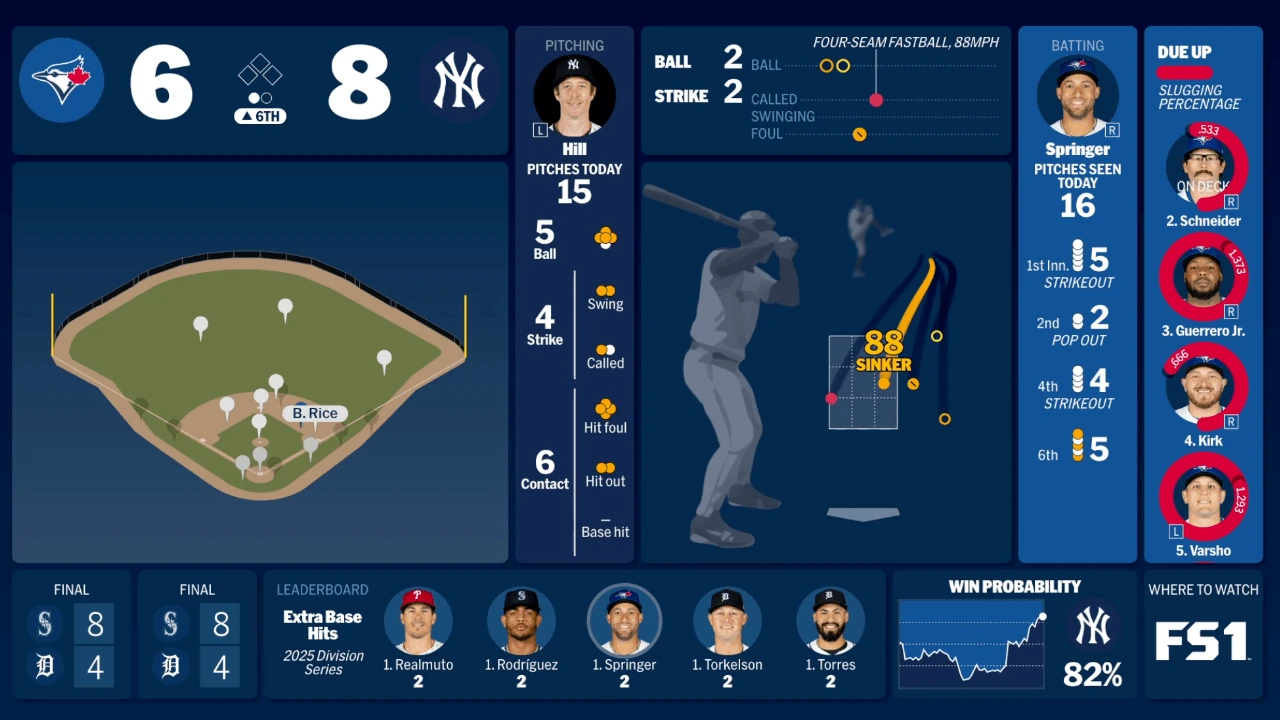
Read the inning, half-inning, score, outs and occupied bases together. A walk can improve the batting team's position without changing the score; an inning-ending out removes the opportunity those runners represented. The resulting line is a compact account of changed circumstances, rather than a separate scoreboard that measures how entertaining the action was.
For a useful recap, choose three points: before the rally, after the lead changed and after the final out. Describe the plays between them in ordinary baseball terms before quoting the percentage changes. This keeps the story attached to observable events and avoids calling every small upward tick a decisive turning point.
Calculate WPA without confusing units
Win Probability Added measures the change between the estimate before a credited event and the estimate after it. MLB's WPA definition gives the basic subtraction. Keep the scale consistent: subtract probabilities expressed as decimals to obtain the familiar WPA value, or subtract percentages to describe a change in percentage points.
In a hypothetical example, moving from forty percent to sixty percent adds twenty percentage points, or +0.20 WPA. It is also a fifty percent relative increase from the starting value, but that is a different calculation with a different denominator. Calling the play merely a twenty percent improvement leaves the units unclear. A reader should be able to tell whether you mean the team's new chance, the change in points or a relative comparison.
A walk-off example and a three-play sequence
Suppose, purely for illustration, a team has a twenty percent chance immediately before a walk-off hit. Once the hit ends the game, the winning team's outcome is settled. The move to one hundred percent represents eighty percentage points, or +0.80 WPA, for that event. The hit did not add eighty runs, and the figure is not a claim that the hitter will succeed eight times in the next ten similar at-bats.
Now follow a different hypothetical team sequence. Its estimate rises from forty to fifty-two percent, drops to forty-five percent and then reaches sixty percent. Those changes are +0.12, -0.07 and +0.15; together they equal +0.20. The arithmetic tracks the difference between the starting and ending states. It does not automatically assign the entire sequence to one player, because different players may have produced the individual events.
FanGraphs explains that its conventional batting and pitching WPA assigns opposite changes to the batter and pitcher. That accounting does not separately distribute defensive credit to every fielder involved. A spectacular catch can therefore matter enormously to the game without making ordinary WPA a complete measure of the catcher's or outfielder's contribution. Use the statistic to locate consequential events, then inspect the play itself before deciding who deserves praise.
Understand what a model leaves out
The most useful limitation is often written beside the tool. When reviewed on November 10, 2026, Baseball Savant's Game Strategy Explorer described its comparisons as independent of the teams and players involved. It also identified a ten-season historical window covering 2016 through 2025. Those are the specifications of that particular tool, rather than a guarantee that every broadcaster or statistical website uses identical inputs.
Consider a fan who knows the closer is unavailable, the next hitter has an injury concern and the bench has already been emptied. An identity-neutral historical table does not suddenly know those details because its answer is displayed beside the team's logo. It can provide a useful baseline while leaving important matchup information outside the calculation. Conversely, another model may include team strength or different adjustments. Read its explanation before assuming the percentages should match.
Rules matter to the comparison too. Savant's published instructions say its tenth-inning setting incorporates the regular-season runner on second; for postseason extra innings, the tool instructs users to select its ninth-inning setting. That instruction belongs to the explorer, not to the official inning label on a broadcast. Our postseason extra-innings guide explains the underlying distinction. Choosing the wrong rule context can make an apparently precise answer describe a different situation.
Historical comparisons also depend on how situations are grouped and which games populate the sample. A figure shown to a decimal place can look more certain than the available evidence warrants. Ask whether the page includes a count, which perspective it uses and whether its method changed across seasons. Avoid filling in missing documentation with assumptions about an unspecified proprietary model.
Finally, a line that rises after a substitution does not by itself prove the manager chose the best option. The play that followed happened; the alternatives did not. The graph helps describe the result of the selected path, while evaluating the decision requires comparing plausible choices with the information available beforehand.
Separate single-game chances from other odds
The word probability does not identify the event being measured. A page can describe tonight's result, the chance of reaching the postseason, a player's contribution to yesterday's comeback or an offered betting price. Comparing their percentages without first naming the event creates a false disagreement.
| Number | Question it addresses | Useful companion information |
|---|---|---|
| In-game win expectancy | How favorable is this current game state? | Inning, score, outs and runners |
| WPA | How much did a credited event change expectancy? | Before-and-after states and attribution |
| Playoff probability | How often does this club qualify in projected seasons? | Current record, remaining schedule and model |
| Betting price | What terms are offered on a particular wager? | Market, timestamp and settlement rules |
Playoff odds answer a season question
FanGraphs describes its playoff model as a simulation using the standings, remaining schedule and projected team performance. A team might have a favorable position in one game while facing a difficult path to a postseason berth. Hypothetical figures of sixty-five percent to win tonight and fifteen percent to qualify for October can coexist because they concern different events and different time horizons.
A completed win changes the record. Its effect on a season forecast also depends on the other teams, games remaining and the projection system. Use the actual MLB standings to establish what has happened. Our dated guide to projected standings explains why a forecast is another kind of information, rather than a replacement for that record.
Betting prices answer a market question
A moneyline or other offered price belongs to a specified wager. A historical win-expectancy table describes comparable game states. Even when both refer to the same matchup, you have not established that they use identical inputs, represent the same timestamp or apply to the same conditions. A difference between them is therefore not automatic evidence that either is wrong or that a profitable opportunity exists.
Before comparing any two displays, finish the sentence each one represents: the chance of what, from when, under which assumptions? If you cannot answer those questions, keep the numbers separate. Nothing in a game-state chart establishes a guaranteed result or converts an explanatory statistic into a betting recommendation.
Use leverage to explain why a routine play matters
Win expectancy tells you the position; WPA describes the change that occurred. Leverage Index considers how much the game could move in the situation confronting the players. It is a useful companion when the score looks ordinary but the next plate appearance could send the game in sharply different directions.
A bases-loaded confrontation late in a close game offers several very different outcomes. A strikeout can leave the threat intact or end it, depending on the outs; a ball in play might produce a run, multiple runs or a double play. Compare that range with the possibilities in a game that has already become a large blowout. The visual excitement of a hard-hit ball is not the only measure of its importance to winning.
FanGraphs uses one as average leverage. The index is not itself a percentage chance of winning, and a higher value does not guarantee a dramatic outcome. It describes the opportunity for a consequential swing, while WPA records the change produced by the event that actually happened. Reading them together separates the situation a player inherited from what the player subsequently did.
This distinction also improves player comparisons. A hitter repeatedly coming up with the game on the line has more opportunity to accumulate large positive or negative swings than someone batting mostly in settled games. A large WPA total can highlight an extraordinary sequence without proving that the player possesses a special skill certain to repeat next season. Likewise, a low-impact hit can still represent good execution and count toward the team's eventual result.
When recapping a rally, identify the important situation before celebrating the outcome. Explain why the next out or baserunner mattered, then describe the play and resulting change. That order gives readers useful baseball context instead of asking the statistic to carry the entire judgment.
Follow a game without treating the graph as a forecast
Use a short routine whenever you open a probability display. It should help you understand the baseball you are following, rather than create another stream of numbers to watch without context. You do not need to reconstruct the provider's entire model to make a much better first reading.
- Confirm the matchup, date and game number, especially during a doubleheader.
- Match the chart to the same completed play shown in the scorecard.
- Identify the team perspective and read the score, inning, outs and runners.
- Describe the event before calculating its change in percentage points or WPA.
- Check the provider's method before interpreting an unexpected result.
- Use the final game status, rather than an earlier high percentage, to establish the winner.
If you are summarizing the game for someone else, keep the provider and relevant moment attached to any number. An unexplained screenshot can lose the team label, timestamp or rule context that made it meaningful. A sentence naming the situation is usually more informative than a dramatic percentage presented on its own.
Compare providers before comparing percentages
When two estimates disagree, first eliminate simple mismatches. One may display the batting team while another displays the home team. One might reflect the latest out while the other still shows the previous batter. A rounded label may also hide a small difference that looks more significant than it is. These checks should come before concluding that one model has discovered something the other missed.
Only then compare documented assumptions: the historical sample, treatment of the count, team-strength adjustments and extra-inning context. If the methodology is undisclosed, describe that uncertainty rather than inventing an explanation. Consistent comparisons made within one provider are often easier to interpret than a collection of percentages taken from unrelated screens.
The most valuable use comes after the play: find the swing, review the event and explain what changed. A walk, defensive stop or baserunning decision can become easier to appreciate. The graph supplies context for the contest; the actual plays and completed result remain the evidence that tells its story.
Loading comments...