
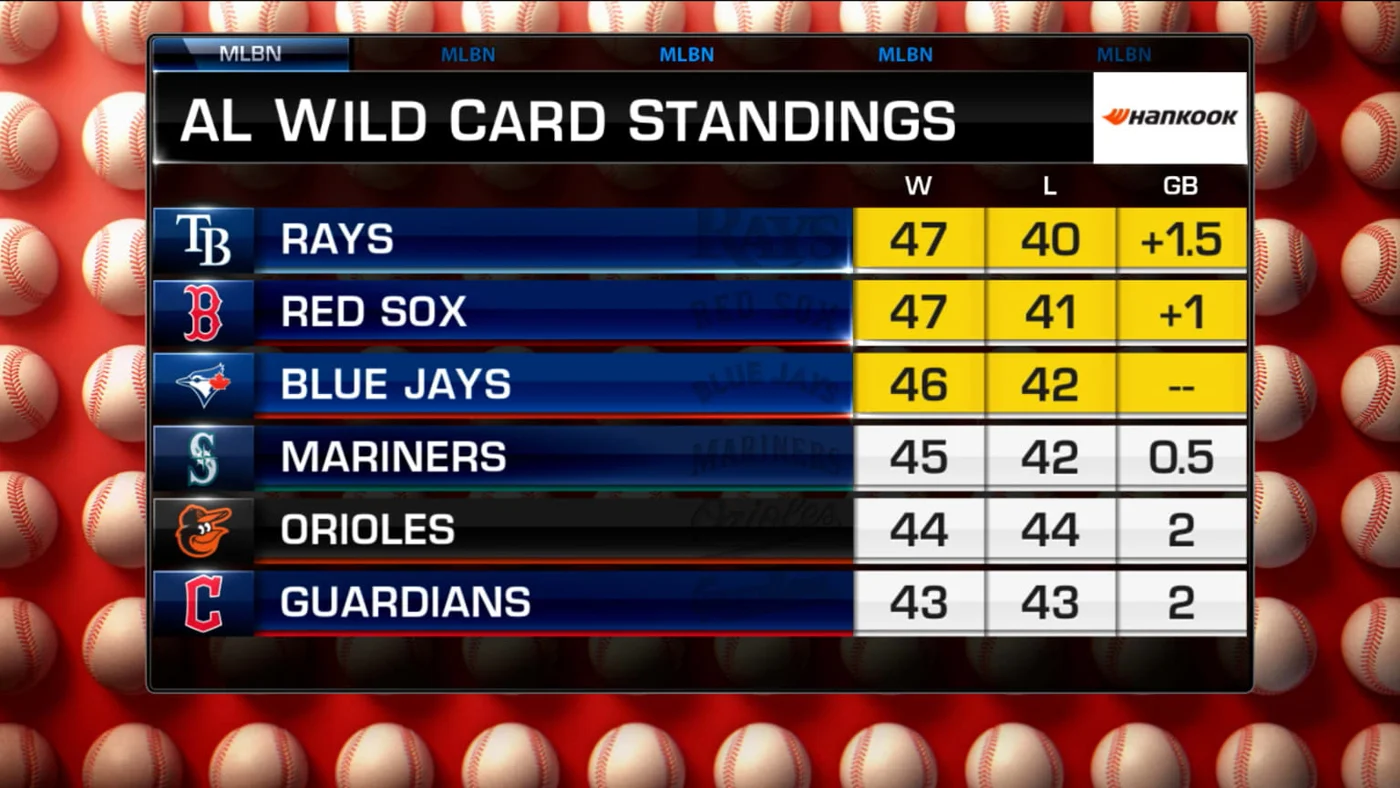
Start with the Wild Card cutoff, not the division leader
To read MLB Wild Card standings, find your league's final qualifying position, compare your team's record with that cutoff, and then check the tiebreaker if the records match. The number beside the league's best team answers a different question. A club can trail its division leader by a large margin while remaining comfortably inside the Wild Card field.
MLB's format provides three Wild Cards per league, separate from the three division winners. That distinction is the foundation of the table. Start with the American League or National League, identify which clubs occupy division-winning positions, and then examine the remaining contenders. Comparing an AL club with an NL club will not tell you whether either has a Wild Card berth.
Think of the division race and Wild Card race as two routes into the same postseason. Your team might be fourth in a competitive division yet still hold a qualifying place. Another team might lead a different division with fewer wins. The second club's route explains why a league-wide list sorted only by wins can look different from the playoff seed list.
Use the current MLB standings for actual records. This guide uses imaginary teams and illustrative numbers so the arithmetic remains useful after today's scores change. The historical graphics are examples of how tables display a race; they are not current standings.
Suppose the final Wild Card position belongs to Harbor at 80-70. Valley is 79-71 and sits immediately below it. Valley's first target is Harbor, even if the first Wild Card team has 90 wins. Saying Valley is ten wins behind the leading contender exaggerates the distance to qualification. The relevant comparison is the last available berth.
There are still reasons to look above that line. Finishing higher can change the opponent or where a series is played. Those questions concern seeding after qualification, however. A useful reading routine keeps the immediate question, reaching the field, separate from the next question, improving the postseason position.
Before interpreting any abbreviation, check the table's heading and date. A division view usually measures the gap to the division leader. A Wild Card view measures a different race. A screenshot from last week can be mathematically correct and practically useless for tonight. Likewise, a postseason bracket records an elimination tournament rather than another month of regular-season standings.
Our MLB playoff format guide explains the bracket in more detail. Here the important habit is simpler: identify the league, identify the qualifying line, read the records, and only then interpret the gap. That order prevents most misunderstandings before any calculation is necessary.
Calculate games behind without guessing
The conventional games-back calculation averages a difference in wins and a difference in losses. Comparing a reference club A with a trailing club B, use ((A wins - B wins) + (B losses - A losses)) / 2. Both columns matter. Looking only at the wins column is the reason many apparently simple comparisons go wrong.
A full-game and half-game example
Return to Harbor at 80-70 and Valley at 79-71. Harbor has one extra win; Valley has one extra loss. Add those two differences and divide by two: (1 + 1) / 2 = 1 game behind. Because each club has played 150 games, that familiar one-game gap is easy to see.
Now make Valley 79-70 instead. The win difference is still one, but the losses are equal. The answer becomes (1 + 0) / 2 = 0.5. Nobody played half a baseball game. The half game reflects unequal numbers of completed games. An off-day, rainout or doubleheader can produce that uneven schedule.
| Reference record | Chasing record | Calculation | Gap |
|---|---|---|---|
| 80-70 | 79-71 | (1 + 1) / 2 | 1.0 |
| 80-70 | 79-70 | (1 + 0) / 2 | 0.5 |
| 80-70 | 78-72 | (2 + 2) / 2 | 2.0 |
Winning percentage supplies another check. Harbor's 80 divided by 150 is .533 when rounded to three decimals. Valley's 79 divided by 149 is .530. Percentage is a ratio; games behind is a comparison of two records. Neither figure tells you how difficult the remaining schedule will be. All records in this table are teaching examples.
Why a plus sign means a cushion
In a Wild Card table, a plus sign typically identifies a club ahead of the final qualifying position. Read +2.0 as a two-game cushion over that reference point, rather than two games outside the field. A dash often marks the reference row itself. Check the particular site's legend because displays do not all label their columns identically.
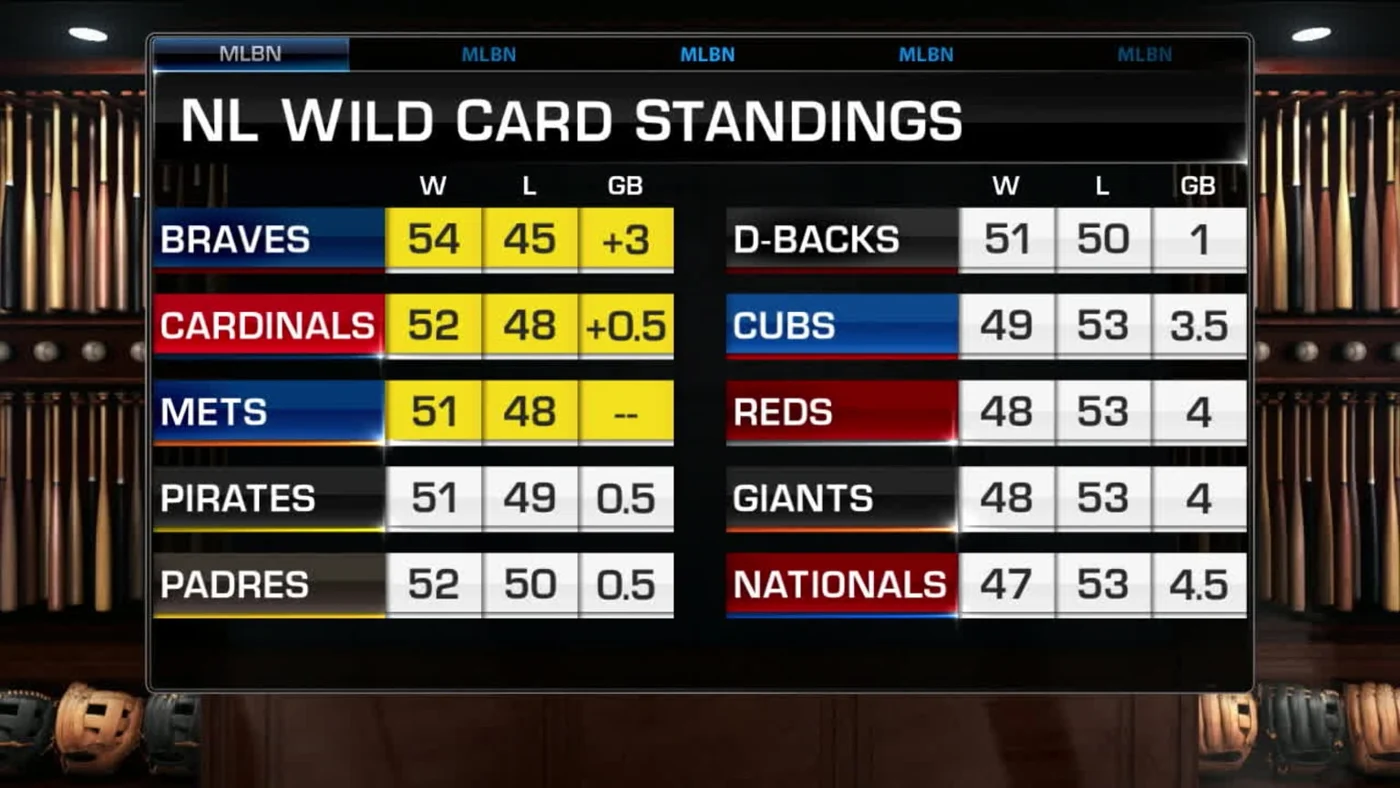
The sign convention does not make the club safe. A cushion is today's margin against a moving reference, not a reservation for October. If another contender passes the cutoff club, tomorrow's comparison may use that new club. Always identify the reference before reusing yesterday's arithmetic.
For especially uneven schedules, do the percentage calculation as well. Two teams can have the same games-back value without identical winning percentages. The useful question is which comparison the table is displaying, rather than which single abbreviation looks most favorable to your team.
Understand what changes after tonight’s games
A standings gap changes when either of the two records in the comparison changes. That sounds obvious, but it explains why your team can gain ground on a day when it does not play, or fail to gain ground after a satisfying win. The other result matters just as much.
Start again with Harbor at 80-70 and Valley at 79-71, one game behind. If Valley wins while Harbor is idle, Valley becomes 80-71. The difference is now half a game. If Harbor loses while Valley is idle, Harbor becomes 80-71 and Valley remains 79-71: another half-game gap. If Valley wins and Harbor loses, both finish 80-71 and the gap disappears.
The reverse is equally useful when interpreting a disappointing night. A Valley loss combined with a Harbor win stretches the gap from one game to two. If both win, it stays at one. If both lose, it also stays at one. A headline saying that a team won does not, by itself, tell you what happened to its position.
Off-days, head-to-head games and the loss column
A head-to-head game between these clubs guarantees both sides of that comparison: one receives a win and the other receives a loss. That is why the games-back distance changes by a full game. Across a three-game series, a sweep can move a three-game gap to a tie. A two-games-to-one series win changes the gap by one game, not two.
The loss column gives an additional way to think about unequal schedules. Suppose Harbor is 80-70 and Valley is 78-70. Valley is one game behind but has the same number of losses. Winning its two extra opportunities would produce 80-70. That is a possible route to equality, not a credit already earned. Games in hand must still be played and won.
Do not silently assign a win to a postponed game. Until an official result enters the standings, the upcoming makeup date is a schedule issue. If your comparison seems wrong, check whether the teams have played different numbers of games or whether the table has refreshed after the latest final. A live score and an updated standings row may not appear simultaneously.
For practical scoreboard watching, pick the cutoff club and the next few relevant challengers. Open today's MLB games to identify those matchups, then note whether any contenders play one another. This small watchlist is usually more informative than treating every game in the league as equally important to your team's immediate race.
Finally, recalculate against tomorrow's actual cutoff. The club occupying that position can change, especially when several teams are separated by a half game. A neat comparison with yesterday's reference may no longer describe the path to a berth. Tracking the qualifying position is more useful than becoming attached to one rival's record.
Separate a tie in the table from a playoff tiebreaker
Games behind describes a margin. A tiebreaker decides an order when the relevant records finish level. Confusing those jobs leads to statements such as "they are tied, so they must play an extra game." MLB now uses mathematical playoff tiebreakers, starting with head-to-head results, rather than Game 163. Consult the official tiebreaker rules for the full procedure.
Equal records do not guarantee equal seeds
Imagine Harbor and Valley each finish 88-74. Their ordinary games-back difference is zero. If Harbor won their season series, that additional information can determine which occupies the higher position. The identical overall records are still identical; the ordering reflects a second comparison rather than an extra win inserted into the standings.
During a race, distinguish holding an edge from permanently securing it. If the clubs still have meetings scheduled, those games may change the eventual season-series outcome. A graphic can describe the position at that moment without guaranteeing the final tiebreaker. Before calling a future result decisive, ask whether the applicable comparison is complete.
Why multi-team ties need their own comparison
Three-way comparisons should not be reduced casually to one favorite matchup. Consider a fictional circle in which Harbor beats Valley, Valley beats Summit, and Summit beats Harbor. Choosing only Harbor's advantage over Valley leaves out the very result that makes the three-club question different.
For a genuine late-season multi-team scenario, list every tied club, the positions being allocated and the results of the relevant comparisons. Then follow the published procedure for that group. A division title and a remaining Wild Card place can involve separate steps. Avoid assuming that the first club removed from a three-team tie leaves an unchanged ranking for every other purpose.
This is also why a prediction screenshot and an official clinching announcement are different evidence. The screenshot may assume outcomes, or show a bracket if the season stopped immediately. A clinching statement has to account for the remaining feasible outcomes.
Clinching is different from leading
A one-game lead with ten games remaining is a lead, not a mathematical guarantee. To understand clinching, compare what the chasing clubs could still achieve. If Harbor already has 90 wins and one rival can finish with no more than 87, that rival cannot pass Harbor. It does not establish that every other contender is also out of reach.
Magic and elimination numbers provide another way to track that boundary. They combine results rather than measure today's games-back gap. Our magic number and elimination number guide explains the distinction. In a crowded race, read the exact goal: a berth, a division title and a particular seed are different achievements, and securing one does not automatically secure the others.
Read the rest of the table in a useful order
Once you understand the cutoff and games back, use the other columns to add context. Read actual wins, losses and winning percentage first. Then check games played, the margin to the qualifying position, the tiebreaker situation and the remaining schedule. Only after those steps should you turn to streaks or broader measures of team quality.
L10 usually summarizes the last ten results, while STRK describes the current consecutive run of wins or losses. Those are short windows. An eight-game winning streak can help explain a sudden jump, but the earlier results still count. A team does not receive a bonus berth for being the hottest club during the final week.
Runs scored and allowed answer a different question. Run differential is runs scored minus runs allowed. A fictional club with 700 scored and 650 allowed has a +50 differential. That arithmetic describes its scoring balance; it does not add 50 wins, erase close losses or settle a postseason place by itself.
Similarly, an expected record estimates performance from scoring rather than replacing official results. Our X-W/L explanation shows how to read that column. If a club's actual record and expected record diverge, you have found a useful analytical question, not an error that should automatically change the standings.
Home and away splits can help you frame the remaining schedule. If most upcoming games are on the road, look at the opponents and pitching availability before deciding what that means. A season split is evidence of past results, not a guarantee about the next series. The same caution applies when somebody labels a team's remaining schedule easy based only on opponent records.
For a quick daily check, write one sentence containing four things: the team's record, its position relative to the final berth, whether the relevant tiebreaker is settled, and the next meaningful matchup. For example: "Valley is 79-71, one game below the cutoff; the season series remains unfinished, and it plays Harbor tonight." That statement explains substantially more than simply reporting "one back."
Check the date again before sharing a graphic. Historical screenshots are useful for learning notation, but a current-sounding caption can turn them into misinformation. During October, regular-season standings are final background while series wins and losses determine advancement. Keep those two records separate when following the playoffs.
You can now read a race without treating every column as a prediction. The standings tell you what has happened and which positions are occupied. The schedule shows the remaining opportunities. Tiebreakers resolve the appropriate equalities. Together they explain the situation; none of them, alone, promises what your team will do next.
Loading comments...