
Here is the short answer: our six division picks are the Rays, White Sox, Astros, Braves, Brewers and Dodgers. This forecast is locked to games completed through August 18, 2026. Keeping a fixed cutoff matters on August 19, when live results can otherwise leave records from different moments sitting in the same comparison.
A prediction this late in the year should begin with wins already earned. Run differential then tests how convincingly a club built its record, while projection systems estimate the range of finishes still available. None of those measures should be used alone. For a deeper explanation of simulated records and their limits, see our 2026 projected standings methodology.
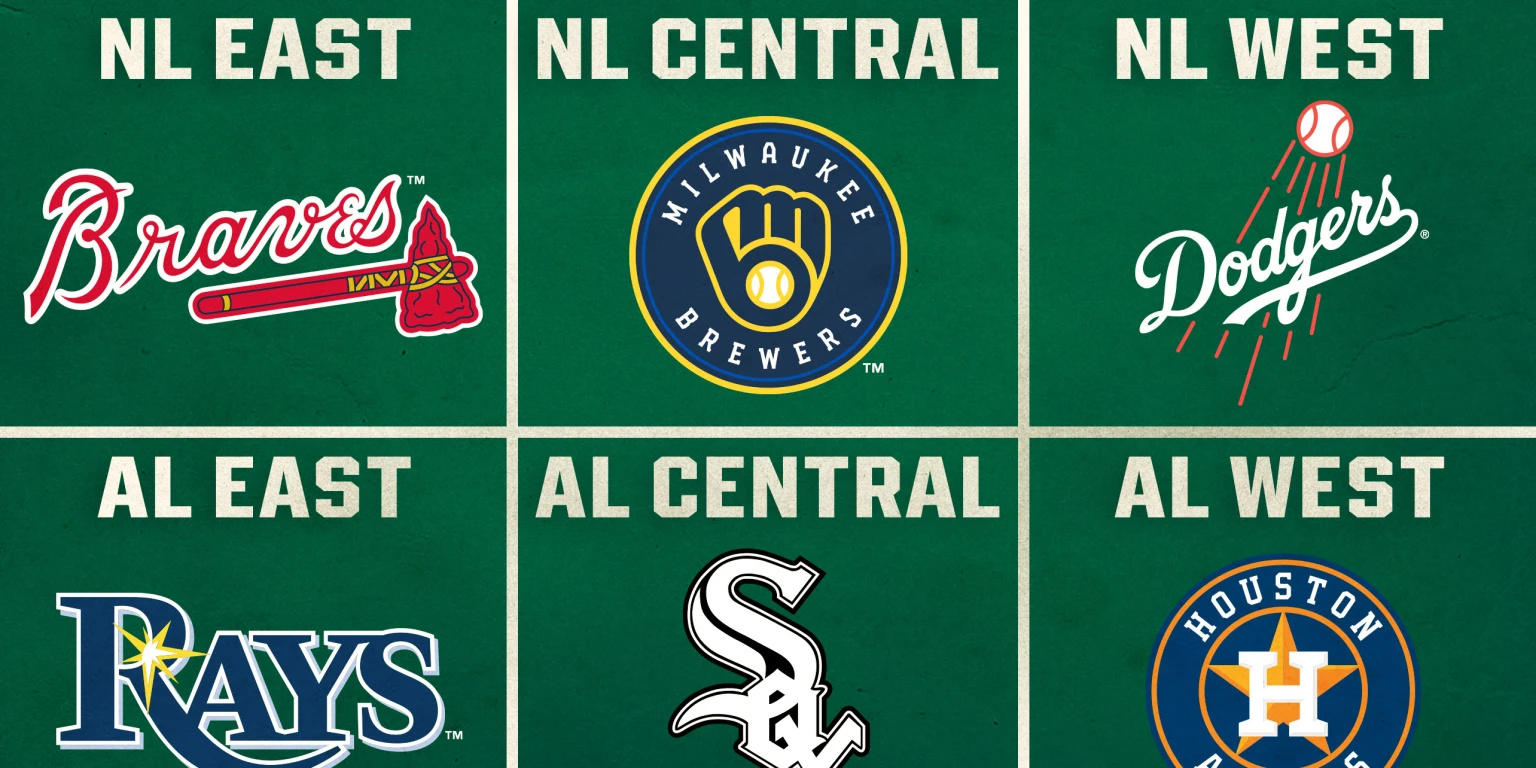
2026 MLB division winner predictions at a glance
| Race | Prediction | Margin | Top challenger | Rating |
|---|---|---|---|---|
| AL East | Tampa Bay | 5.0 games | New York | Medium-high |
| AL Central | Chicago | 4.0 games | Detroit | Medium |
| AL West | Houston | 1.0 game | Texas | Low |
| NL East | Atlanta | 5.5 games | Philadelphia | High |
| NL Central | Milwaukee | 4.5 games | Chicago | High |
| NL West | Los Angeles | 8.0 games | San Diego | Very high |
The confidence scale is editorial, not a sportsbook line. Los Angeles earns the strongest rating because it pairs the largest lead with a +143 scoring margin. Houston gets the weakest because a 63-63 club led Texas by only one game and had a -32 differential. The other four calls fall between those extremes, with the schedule deciding how much direct leverage a challenger still owns.
Baseball-Reference supplies a useful, explicitly older checkpoint. Using standings through July 30 and 25,000 simulations, its division favorites were Tampa Bay at 73.2%, the White Sox at 71.3%, Texas at 44.4%, Atlanta at 93.5%, Milwaukee at 91.0% and the Dodgers at 99.8%. Houston replacing Texas on our board is intentional: the Astros had moved into first by the newer official cutoff. A July 30 probability cannot overrule results that happened afterward.
FanGraphs illustrates the broader principle. Its system combines current standings, the remaining schedule and projected team strength over 20,000 simulated seasons. FanGraphs also notes that a rounded 100.0% is not necessarily an official clinch. That distinction applies throughout this article: high confidence means the evidence strongly favors one outcome, not that another outcome has become impossible.
Read each division below as a decision at one moment. Every section identifies the lead, the strongest counterargument and the remaining series most capable of changing the call. The AL West needs daily review; the Dodgers require a sustained reversal before their forecast should move.
AL East prediction: Tampa Bay Rays
Forecast: Tampa Bay, with New York as the first challenger. The Rays reached the August 18 cutoff at 75-50. New York was 70-55 and Boston 68-58, leaving deficits of five and 7.5 games. That separation is large enough to make Tampa Bay the favorite but small enough that the last two direct series still belong on every fan's calendar.
Why the lead wins the argument today
Tampa Bay had about 37 games remaining after the snapshot. To erase five games without help from head-to-head play, the Yankees would need to gain roughly one win on the Rays every seven or eight games. That is achievable, but it requires a sustained difference in results rather than one hot weekend. Boston must create an even faster swing from farther back.
The dated model supports the same hierarchy. Baseball-Reference's July 30 simulation table listed Tampa Bay at 73.2% to win the East, New York at 20.7% and Boston at 6.0%. Those percentages describe an earlier checkpoint, not the odds on August 19. Their proper use is to show that the Rays' favorite position was not created by one recent result.
Why the chase is healthier than the records suggest
The run totals keep this from being a high-confidence runaway. New York owned a +87 differential and Boston a +96, compared with Tampa Bay's +48. The pursuers have therefore produced stronger overall scoring margins even though they trail in wins. That difference raises the chance of pressure; it does not award either club victories that are already in Tampa Bay's column.
The schedule supplies the pressure points. Boston plays three games against the Rays from September 18-20. New York then gets four games over September 22-24. If the margin remains five entering those dates, Tampa Bay can trade wins and consume the calendar. If it falls to two, the direct meetings can change first place quickly.
Use three checkpoints rather than reacting nightly: the margin before the Boston series, the margin after it, and the margin before the four-game Yankees set. The Rays remain the choice because they control that starting number. New York's closer position makes it the main threat, while Boston's superior scoring margin makes it the dangerous third team. The forecast is Tampa Bay, but September offers both rivals a defined route to overturn it.
AL Central prediction: Chicago White Sox
Forecast: Chicago, but this is a four-team race. The White Sox were 65-60 after August 18, four games in front of Minnesota and 4.5 ahead of Cleveland and Detroit. Chicago's +44 run differential gives the leader more support than its modest winning percentage alone. It has both the wins and a positive scoring margin, so a challenger must dislodge it rather than merely expose a weak first-place profile.
The closest team is not the same as the strongest warning
Minnesota's 62-65 record made it the nearest pursuer, but the Twins had been outscored by 43 runs. Cleveland was one-half game farther back with a -25 differential. Detroit also sat 4.5 back, yet its +83 margin was 126 runs better than Minnesota's. That contrast makes the Tigers our primary threat even though the Twins begin slightly closer.
Record and scoring margin can separate for several reasons, and the gap does not command an automatic correction. It tells readers where to look more closely. Our MLB expected win-loss guide explains the signal and its limitations. For this forecast, Chicago's four-plus-game cushion remains more important than assigning Detroit hypothetical wins.
The older simulation checkpoint also began from a stronger White Sox position. Baseball-Reference's July 30 table showed Chicago at 71.3% for the division, Cleveland at 17.1%, Minnesota at 8.0% and Detroit at 3.6%. The date is crucial because Detroit has improved its place in the race since then. The figures describe what the model saw on July 30; they do not settle the August 19 argument.
Chicago faces two different tests
First come six games against Minnesota, split between August 28-30 and September 4-6. That gives the closest club repeated chances to turn a four-game deficit into direct gains. Chicago's second test is four games against Detroit from September 17-20, when the team with the best scoring margin in the division can attack the leader head to head.
The update plan is straightforward. Reassess after the second Minnesota series: if Chicago preserves or expands its lead, the Twins lose most of their direct leverage. Then check again when Detroit arrives. A strong White Sox showing across those ten games would make the remaining calendar work heavily in their favor. A losing stretch would pull multiple teams into the same narrow band.
Chicago is the pick because it owns the advantage everyone else is chasing and has outscored its opponents overall. Detroit is the danger signal, Minnesota has the first schedule opportunity, and Cleveland remains close enough to benefit from both. That combination justifies medium confidence—decisive enough to choose the White Sox, cautious enough to revisit the call twice.
AL West prediction: Houston Astros, by the smallest margin
Forecast: Houston as the positional favorite; Texas as the strongest counterpick. The Astros finished August 18 at 63-63, one game ahead of the 62-64 Rangers. Seattle was four games out at 59-67. First place is enough to give Houston the answer today, but not enough to separate the club clearly from Texas.
Why this race resists a confident pick
Every serious contender had a negative run differential: Houston -32, Texas -42 and Seattle -45. In other divisions, a leader's scoring margin either reinforces its position or highlights a challenger. Here, the three profiles are compressed. The Astros have the best record and the least-negative margin of the group, yet neither advantage is large.
The July 30 Baseball-Reference simulation offers a legitimate case for the Rangers. At that earlier point, Texas carried a 44.4% division probability, Houston 30.1% and Seattle 25.2%. Since then, Houston has taken first place. The conflict is informative rather than inconvenient: the current standings favor the Astros, while the older model demonstrates that Texas was recently the forecast leader. Calling those July figures current odds would erase the very movement this section is trying to explain.
No direct showdown means constant scoreboard pressure
MLB's remaining schedule contains no Houston-Texas game after August 19. The two clubs cannot manufacture the fastest two-way swing by beating each other. If Houston wins, Texas cannot stop it that night; if Texas wins, it still needs another opponent to hand Houston a loss. That independence makes the division a daily comparison of separate series.
Seattle does retain two late games against Houston on September 22-23. Four games is not an insurmountable deficit, but the Mariners must first draw closer for those dates to become a path to first. The Angels and Athletics, 13 and 14 games back respectively, sit outside the practical three-team forecast.
The appropriate update cycle is daily, after games become final. Houston keeps the pick as long as it holds the lead because there is no stronger current separator. Texas should replace it immediately if the standings flip and the underlying comparison remains this close. Seattle stays on the edge of the frame until the gap narrows. This is low confidence by design: it states which team leads the evidence now without pretending the race has a stable favorite or offering a betting guarantee.
NL East prediction: Atlanta Braves
Forecast: Atlanta, with high confidence. The Braves stood at 74-52 after August 18, 5.5 games clear of Philadelphia. Atlanta's +112 run differential was exactly 100 runs better than the Phillies' +12. The lead is already meaningful; the performance gap behind it makes the forecast stronger.
A two-team race with one final stress test
Miami was 64-63 and 10.5 games behind Atlanta. Washington trailed by 14.5 and the Mets by 17.5. Those clubs still affect the schedule, but Philadelphia is the only pursuer near enough to define the division prediction. The Phillies do not need an impossible comeback, yet they need more than Atlanta playing average baseball while they do the same.
The July 30 model snapshot underscores how much work Philadelphia already faced. Baseball-Reference gave Atlanta a 93.5% division chance and the Phillies 3.8% at that time. Those values are historical markers, not an August price. The forecast here would remain Atlanta without them because the current lead and current scoring margins independently point in the same direction.
Seven direct games keep the call from becoming absolute. Atlanta and Philadelphia meet four times from September 4-7, then three more from September 11-13. A direct win is especially valuable to the challenger because it simultaneously adds one Phillies victory and one Braves loss. That mechanism can move the gap faster than parallel series against different opponents.
What Philadelphia must do
The Phillies first need to shorten the 5.5-game margin before September 4. If the gap remains there, winning four of seven head to head would gain only one game across the set; Atlanta could accept that outcome and leave with most of its cushion. Philadelphia needs a much stronger combined result—or significant help elsewhere—to make the final weeks level.
For Atlanta, the task is the inverse. A 4-3 or better record across the seven games would remove every direct opportunity without losing ground. Even a 3-4 result could be acceptable if the Braves enter with the same lead. That is why the September 4 number matters more than the drama of any single inning.
Check the standings at the start of the first series, then judge the two blocks together. Atlanta's current record, five-plus-game bank and enormous run-differential advantage all support the same pick. Philadelphia owns enough direct leverage to test it, which keeps the word “prediction” necessary. Braves is the clear answer; the seven-game sequence is the only scheduled event capable of changing that answer quickly.
NL Central prediction: Milwaukee Brewers
Forecast: Milwaukee, with Chicago still dangerous. The Brewers carried a 78-48 record and a +158 run differential through August 18. The Cubs were 74-53, 4.5 games behind, with a +103 margin. Chicago's profile is strong enough to lead many races; Milwaukee simply entered this checkpoint with an even better record and a 55-run advantage in scoring differential.
This is not leader versus pretender
St. Louis was 13.5 games out, with Pittsburgh and Cincinnati farther back. That leaves a practical two-team contest in which both clubs have outscored opponents by more than 100 runs. The forecast should therefore recognize Chicago's quality rather than describe the margin as evidence that the Cubs are fading.
Baseball-Reference's July 30 simulations favored Milwaukee 91.0% to 8.9% for Chicago. Those numbers belong to that date and cannot account for everything that followed. They do align with the current choice, but the more immediate evidence is the Brewers' four-plus-game cushion and superior scoring margin.
Treat seven meetings as a mini-race
The clubs play four times from August 31 through September 3 and three times from September 7-9. Across seven games, a 4-3 Cubs edge gains only one direct game in the standings. A 5-2 result gains three; a 6-1 result gains five. Those examples explain why Chicago needs a clearly lopsided combined performance to erase a 4.5-game deficit through head-to-head play alone.
The arithmetic is not an official magic-number calculation. Both teams play other opponents around the two series, so the actual gap can move before, between and after them. It is a simple way to show Milwaukee's strategic advantage: a near-even split helps the leader far more than the challenger because every completed game removes one recovery opportunity.
Fans should evaluate the seven meetings together. If Milwaukee goes 4-3 or better, Chicago loses its most efficient route to first. If the Cubs win at least five, the second series may end with a genuinely compressed race. One spectacular game changes momentum; the aggregate result changes the math.
Milwaukee receives high confidence because three signals agree—the existing lead, the largest run differential in this article's snapshot and the older model edge. Confidence stops below “very high” because the Cubs are strong and still control seven direct chances. The Brewers are the pick, while Chicago's required task is unusually clear: win the mini-race decisively.
NL West prediction: Los Angeles Dodgers
Forecast: Los Angeles, the strongest pick on this board. The Dodgers were 76-51 through August 18, eight games ahead of San Diego and ten ahead of Arizona. Their +143 run differential dwarfed the Padres' +5 and the D-backs' +3. Unlike the AL West, the standings margin and the scoring profile tell the same story.
Three independent barriers face the challengers
The first is the existing gap. San Diego must gain eight games and Arizona ten over a schedule that is already well past the midpoint. The second is performance: Los Angeles' differential was 138 runs better than the nearest team's. The third is direct opportunity, which is scarce.
The Padres have only three games against the Dodgers, September 22-24. If the deficit is still eight when that series begins, a San Diego sweep would leave five games of separation rather than create a tie. Arizona has no remaining game with Los Angeles in the checked post-August 19 schedule, so it cannot force even that three-game swing.
Baseball-Reference's July 30 model snapshot was even more decisive: 99.8% for the Dodgers, 0.2% for Arizona and below 0.1% for San Diego. Those numbers are not current and 99.8% is not an official clinch. Their role is limited to showing that an established forecast and the later August standings point in the same direction.
A practical test for changing the forecast
Do not downgrade this pick because of one loss. Look instead for the lead to fall below five games before the September 22 Padres series. That threshold is an editorial monitoring rule, not a formal elimination line. It identifies the point where the final direct set could produce a one-series change rather than merely reduce a comfortable advantage.
Arizona's update test is tougher. Without another Dodgers matchup, the D-backs need a sustained winning run and repeated Los Angeles losses against other clubs. San Diego at least controls three results, but it must do most of the closing work before those games arrive.
The Dodgers earn very high confidence because all three barriers reinforce one another: eight games in the bank, a 138-run differential edge over second place and only three direct games with that pursuer. Baseball still permits unlikely reversals, so this remains a forecast. Among the six races, however, Los Angeles requires the largest body of contrary evidence before the pick should change.
What could flip a division pick before October?
The forecast should move when the evidence moves, not when one score looks dramatic. Begin with final results on the MLB games today page, then use the tomorrow schedule to identify the next direct opportunity. Probable pitchers, transactions, injuries, postponements and start times are game-day inputs; confirm them close to first pitch on the full MLB schedule hub instead of carrying an old assumption forward.
Use a different refresh cadence for each race
| Race group | When to reassess | Trigger |
|---|---|---|
| AL West | After every completed day | Houston's one-game lead changes hands |
| AL East | Before Sept. 18 and Sept. 22 | Rays' lead enters direct Boston/New York sets below three |
| AL Central | After the six Minnesota games; after Detroit | Chicago loses its four-game cushion |
| NL East/Central | At the start and end of each seven-game block | Phillies or Cubs win the combined direct series decisively |
| NL West | Weekly, then before Sept. 22 | Dodgers' margin falls below five |
The thresholds are monitoring rules, not magic numbers. They focus attention on the point where a direct series can transform a race. Models can help with the broader range of outcomes: FanGraphs says its playoff system combines current standings, remaining schedule and projected performance across 20,000 simulations. Its own explanation also warns that a rounded 100.0% does not necessarily mean a team has officially clinched.
Track the tiebreaker before the final day
MLB no longer schedules a Game 163 to settle a regular-season tie. For two tied clubs, the published order begins with head-to-head record, followed by intradivision record and intraleague record. If those remain even, the procedure moves to second-half intraleague results and additional lookback steps.
That rule changes how to value the remaining division games. A win can improve the standings today and bank the first tiebreak criterion for September 27. Fans following a close race should therefore record both the games-back column and the season-series result. In the AL West, where Houston and Texas have no direct games left, their already-completed head-to-head result may matter if the final records match.
Run differential belongs in the update, too, but as a diagnostic. A leader whose margin deteriorates while its pursuer's improves deserves a lower confidence grade; neither trend awards future wins. The same restraint applies to model movement. Always read the update time before the percentage and never turn a simulated probability into a betting promise.
This article answers only who is most likely to win each division at the August 18 checkpoint. It does not predict the full Wild Card field or the World Series. Tampa Bay, the White Sox and Houston require the closest surveillance. Atlanta and Milwaukee have stronger positions but face concentrated head-to-head tests. Los Angeles has the clearest edge. That hierarchy—and the six team picks—should change only when new completed games materially change the gaps, not because the calendar advanced by one day.
Loading comments...