
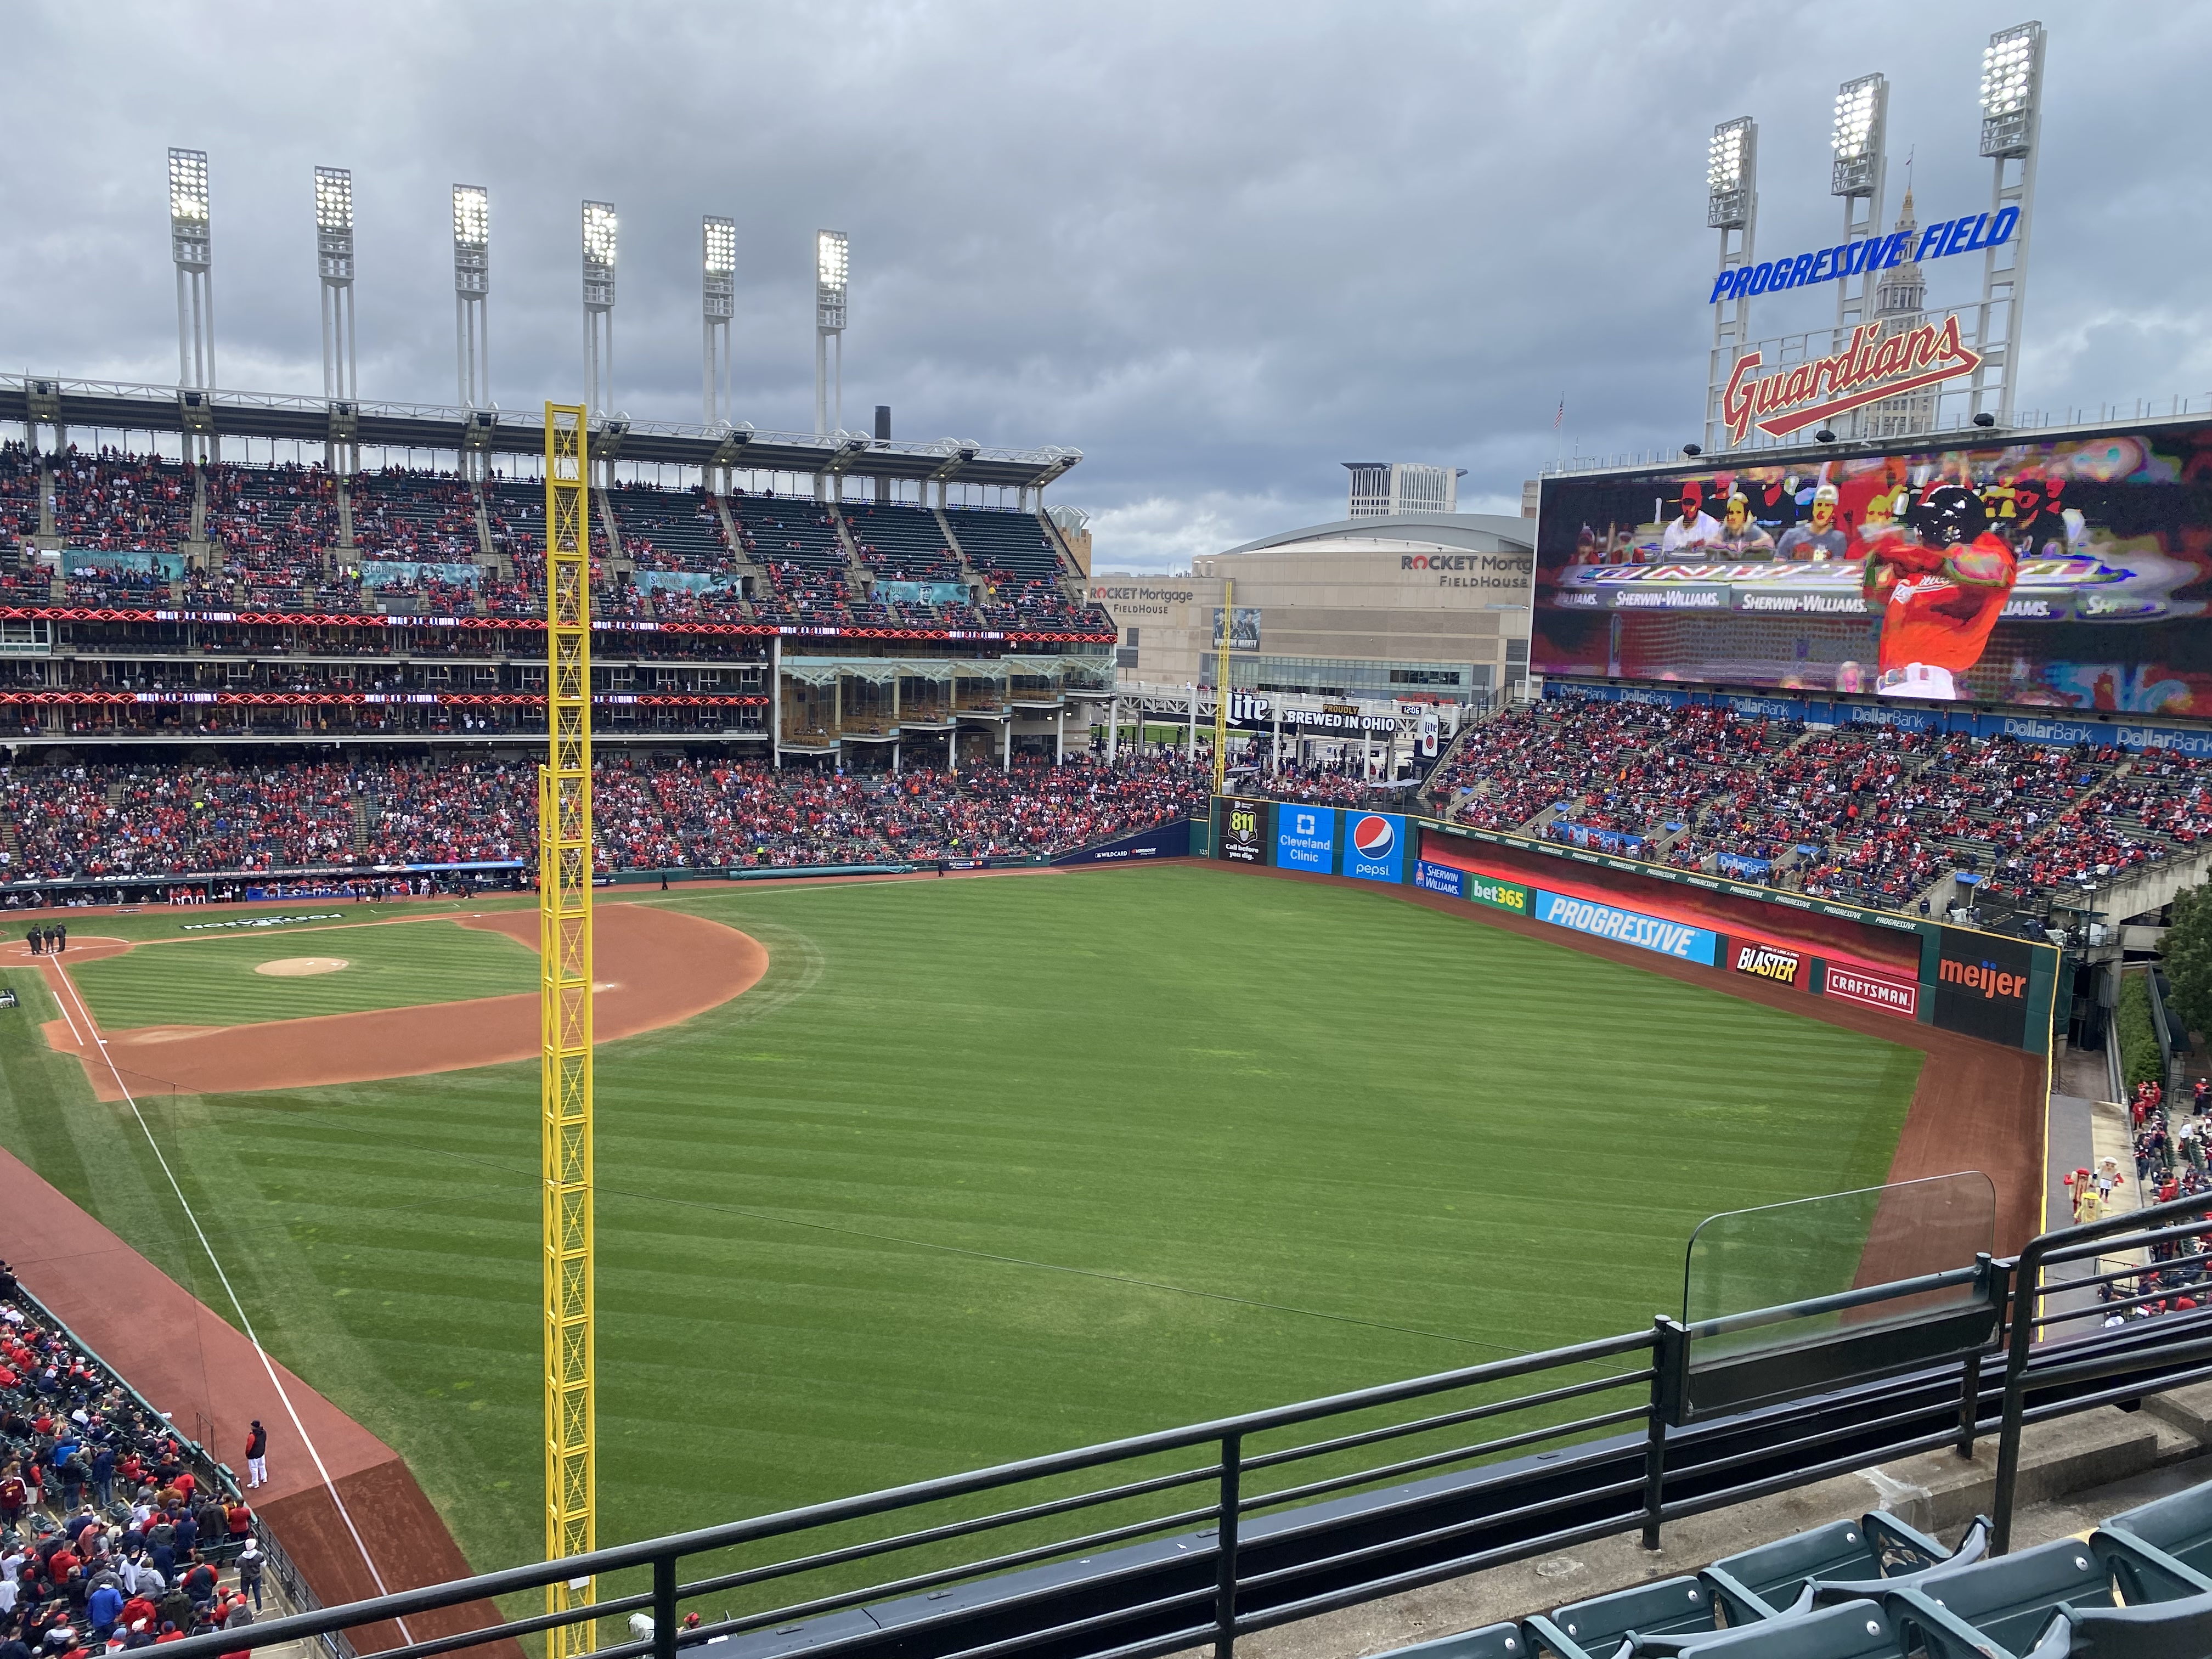
Snapshot entering games of August 12, 2026: Cincinnati had MLB's hardest remaining schedule by current opponent winning percentage at .5477. Cleveland had the easiest at .4590. The Cubs, Braves, Mets and Brewers completed the hard end's top five; the Mariners, Astros, Royals and White Sox joined the Guardians at the easy end.
Those figures are descriptive, not promised results. We matched every regular-season game scheduled from August 12 through September 27 with each opponent's winning percentage in MLB's August 12 standings, then weighted opponents once per remaining meeting. Records, postponements and team strength will change, so use the site's current MLB standings for the latest race. This article preserves the dated calculation, shows all 30 clubs and explains where the biggest schedule advantages actually sit.
How this remaining schedule ranking was calculated
The source schedule is MLB's regular-season feed for August 12 through the official September 27 finale. The source records are MLB's standings for August 12 before that day's games. For each team, we listed every remaining opponent, attached that opponent's current winning percentage and averaged those values over every game:
Remaining SOS = sum of each remaining game's opponent winning percentage ÷ remaining games
A seven-game opponent is counted seven times, while a three-game opponent is counted three times. That game weighting is important: taking a simple average of unique opponents would make a single series count as much as seven head-to-head games. In this convention, a higher number means a harder schedule because the remaining opponents have won more often to date.
The integrity checks reconciled. MLB's feed contained 629 remaining games, creating 1,258 team-games. The sum of all 30 clubs' remaining-game counts was exactly 1,258, and every club's games already played plus its scheduled remaining games equaled 162. Clubs had between 41 and 44 games left because they had not all played the same number entering August 12.
This is deliberately the simplest reproducible method. It does not use opponent-of-opponent strength, projected rest-of-season talent, home-field adjustment, probable pitchers or park factors. It also freezes opponent records at the snapshot rather than letting later results leak into the calculation. That makes the table easy to audit, but it is not a playoff simulation.
Reading example: an SOS of .520 means the opponents on that club's remaining schedule had a .520 average winning percentage when weighted by scheduled games. It does not predict that the club will win 52.0% or 48.0% of its remaining games.
All 30 MLB remaining schedule strength rankings
The table is ordered hardest to easiest using the August 12 snapshot. “H-A” separates remaining home and road games but does not change the SOS calculation.
| Rank | Team | Record | Left | H-A | Opp. win% |
|---|---|---|---|---|---|
| 1 | Reds | 57-61 | 44 | 21-23 | .5477 |
| 2 | Cubs | 70-50 | 42 | 22-20 | .5269 |
| 3 | Braves | 72-48 | 42 | 20-22 | .5236 |
| 4 | Mets | 53-68 | 41 | 22-19 | .5219 |
| 5 | Brewers | 74-46 | 42 | 18-24 | .5210 |
| 6 | Marlins | 61-59 | 42 | 20-22 | .5196 |
| 7 | Phillies | 64-57 | 41 | 19-22 | .5184 |
| 8 | Orioles | 58-62 | 42 | 19-23 | .5155 |
| 9 | Rockies | 47-73 | 42 | 22-20 | .5132 |
| 10 | Giants | 50-70 | 42 | 23-19 | .5070 |
| 11 | Pirates | 58-63 | 41 | 21-20 | .5063 |
| 12 | Rays | 73-46 | 43 | 22-21 | .5009 |
| 13 | D-backs | 64-57 | 41 | 19-22 | .4993 |
| 14 | Padres | 64-57 | 41 | 19-22 | .4986 |
| 15 | Cardinals | 60-60 | 42 | 16-26 | .4985 |
| 16 | Tigers | 59-60 | 43 | 23-20 | .4942 |
| 17 | Red Sox | 64-55 | 43 | 21-22 | .4942 |
| 18 | Dodgers | 71-48 | 42 | 23-19 | .4937 |
| 19 | Nationals | 59-62 | 41 | 20-21 | .4925 |
| 20 | Twins | 59-62 | 41 | 22-19 | .4910 |
| 21 | Yankees | 67-52 | 43 | 25-18 | .4907 |
| 22 | Blue Jays | 58-63 | 41 | 20-21 | .4903 |
| 23 | Angels | 46-74 | 42 | 21-21 | .4876 |
| 24 | Athletics | 47-73 | 42 | 22-20 | .4868 |
| 25 | Rangers | 60-60 | 42 | 22-20 | .4858 |
| 26 | White Sox | 61-57 | 44 | 22-22 | .4848 |
| 27 | Royals | 49-71 | 41 | 22-19 | .4829 |
| 28 | Astros | 61-60 | 41 | 22-19 | .4818 |
| 29 | Mariners | 56-64 | 42 | 19-23 | .4758 |
| 30 | Guardians | 58-62 | 42 | 22-20 | .4590 |
The spread from Cincinnati to Cleveland is 8.87 percentage points. That is meaningful across roughly six weeks, but the middle compresses quickly: Arizona at .4993, San Diego at .4986 and St. Louis at .4985 are essentially facing .500 opponents by this simple measure. Small thousandths-place differences should be treated as ordering aids, not evidence of materially different futures.
The five hardest remaining schedules
1. Cincinnati Reds — .5477
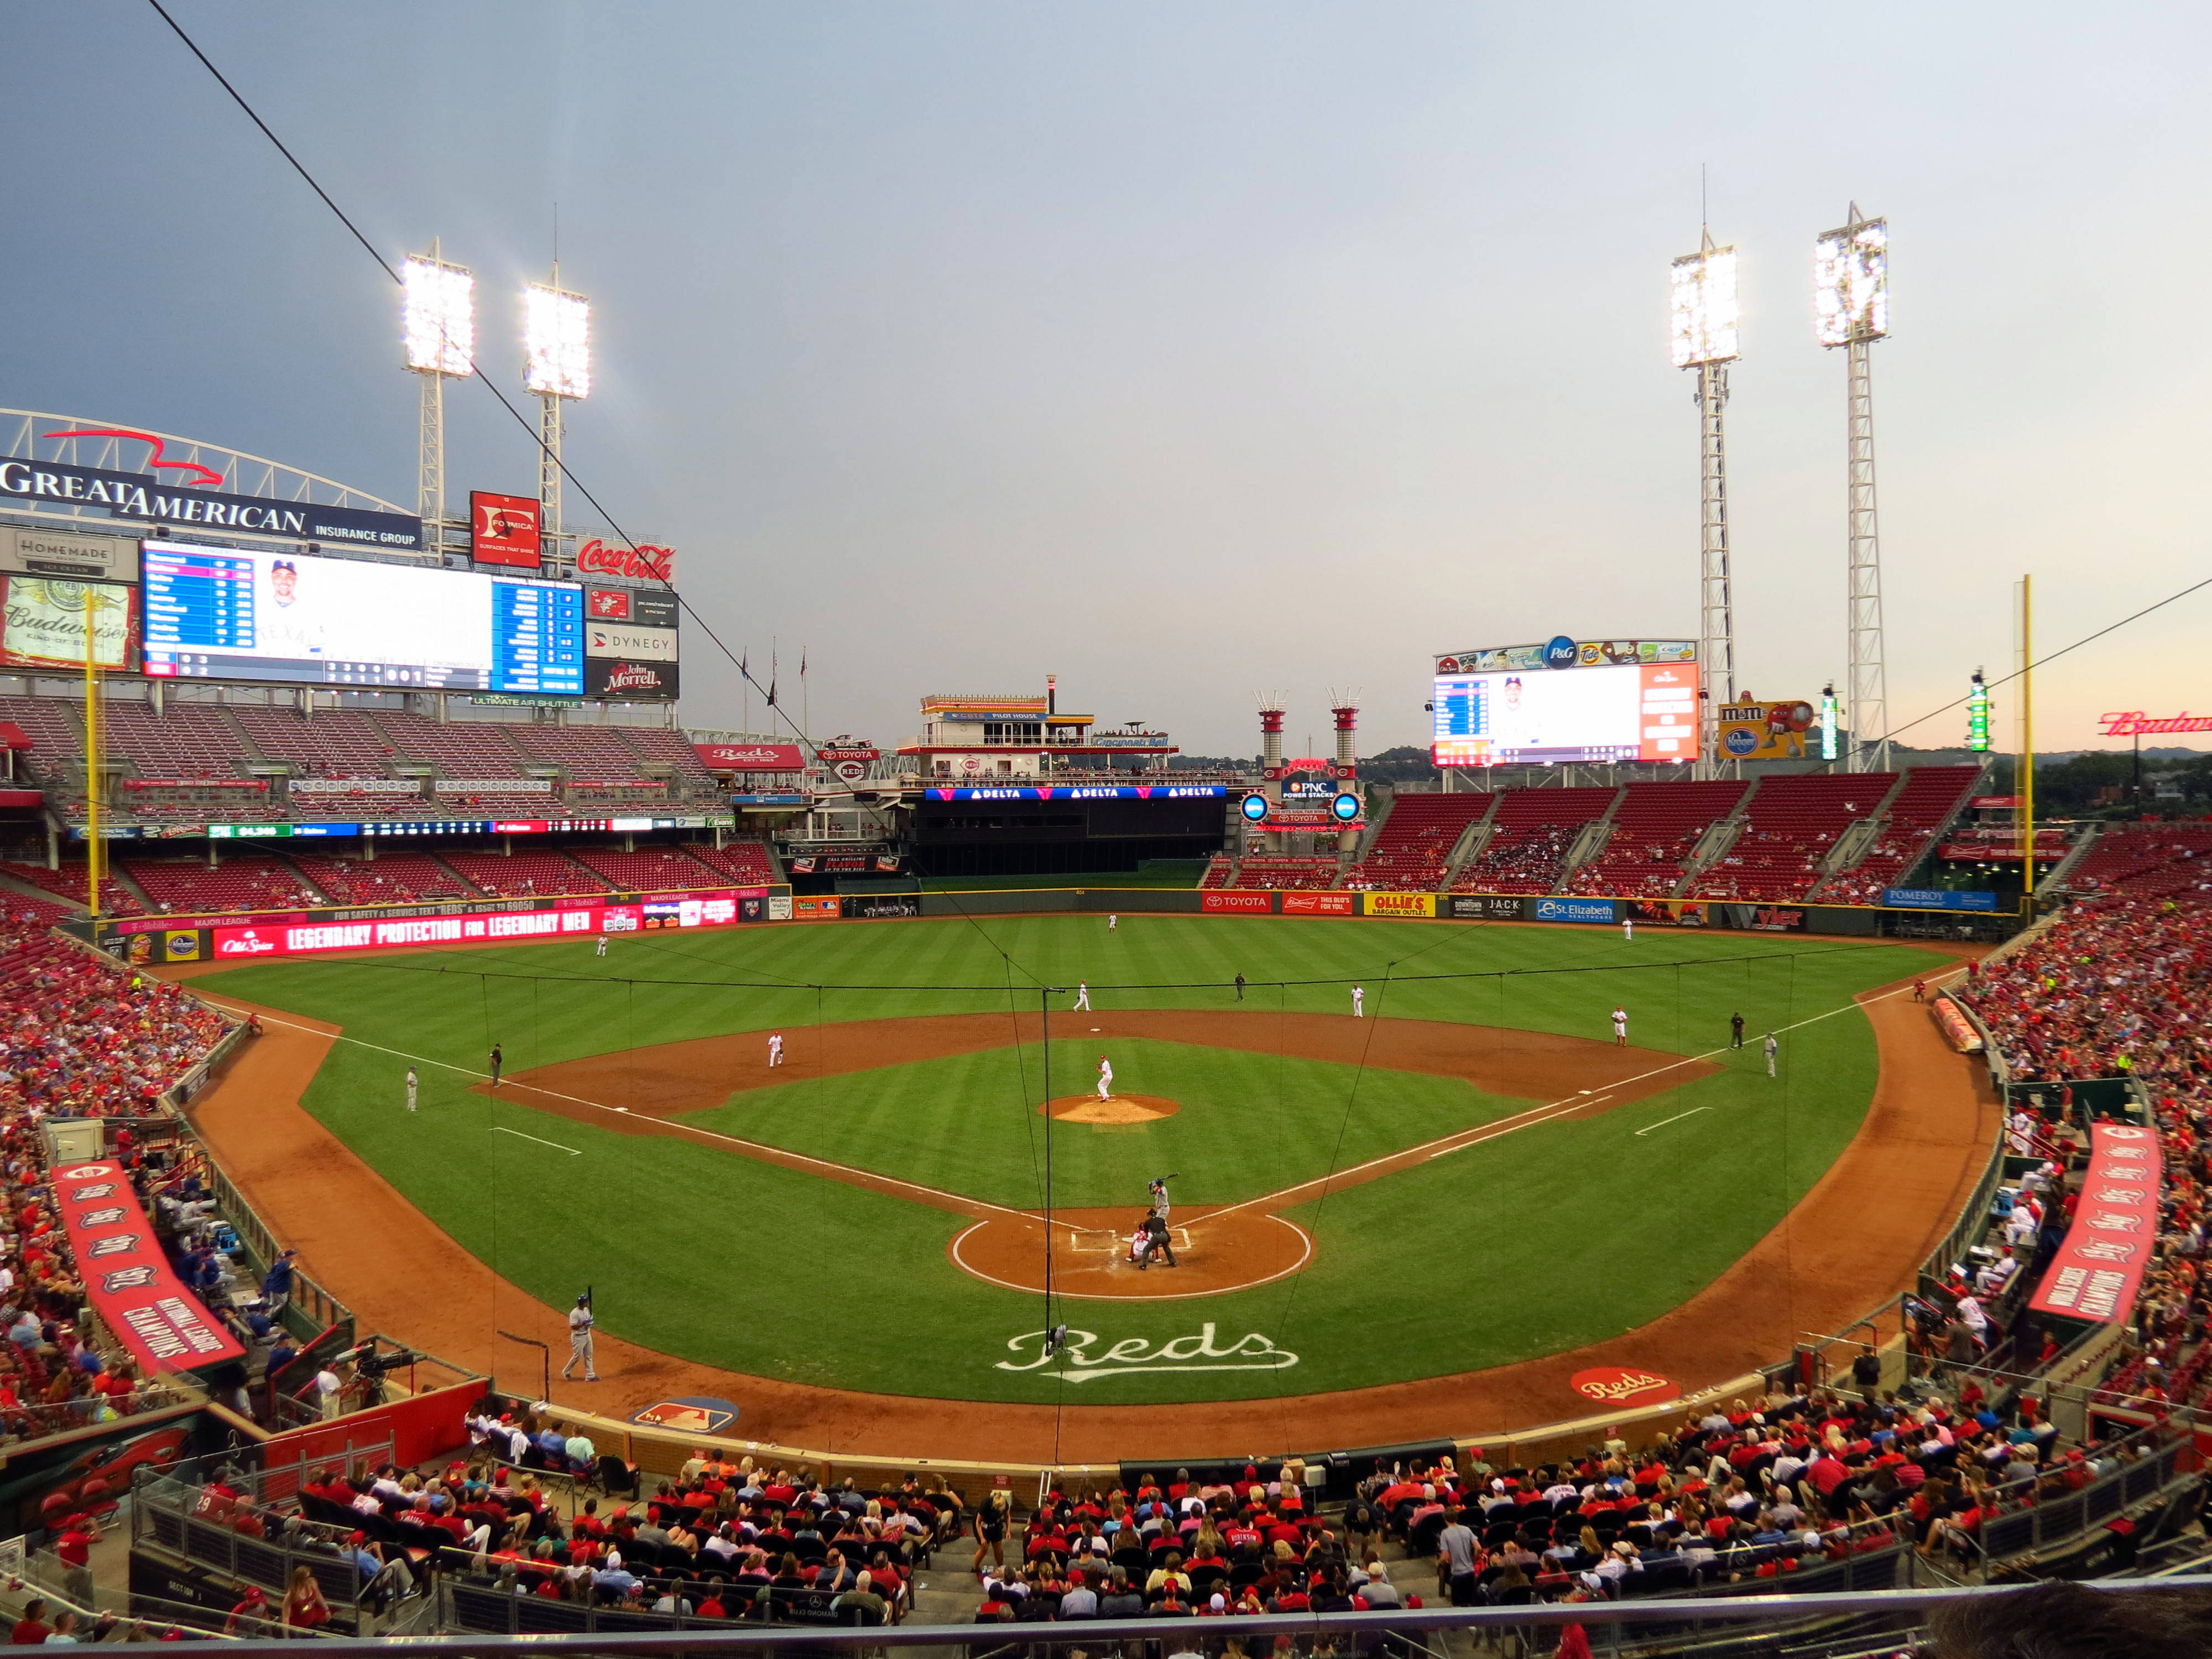
Cincinnati's slate is a clear outlier. Of 44 remaining games, 38 are against clubs at .500 or better in the snapshot and 22 are against clubs at .550 or better. The repeat business is demanding: seven games with the Dodgers, six with Milwaukee, six with the Cubs and five with St. Louis. That mix gives the Reds many opportunities to change the race directly, but very few soft stretches.
2. Chicago Cubs — .5269
The Cubs have 42 left, including seven against Milwaukee, six against Miami and six against Cincinnati. Twenty-eight are against .500-or-better clubs. Their seven meetings with the Brewers create the section's most important distinction: difficult does not mean disadvantageous when the hard games also offer a direct way to cut into the team ahead.
3. Atlanta Braves — .5236
Atlanta pairs a 72-48 starting position with 29 of 42 remaining games against .500-or-better opponents. Seven against Philadelphia dominate the divisional story, while three-game sets with the Cubs, Dodgers, Astros, Rays and Brewers keep the overall average high. The existing cushion matters; SOS changes the road, not the wins already banked.
4. New York Mets — .5219
New York's 41-game finish contains six against Washington and four against Philadelphia, followed by a broad collection of three-game sets against contenders. Twenty-nine games are against teams currently at least .500. At 53-68 entering the day, the Mets' hard schedule is more an obstacle to a comeback than pressure attached to a division lead.
5. Milwaukee Brewers — .5210
Milwaukee has the smallest home allocation in this group: 18 home games and 24 road games. Seven with the Cubs, six with the Reds and four with the Dodgers account for much of its difficulty. Fourteen of 42 games are against .550-or-better clubs, the second-highest total in this top five after Cincinnati. A tough slate therefore follows the 74-46 Brewers even though they began the snapshot with MLB's best record.
The five easiest remaining schedules
30. Cleveland Guardians — .4590
Cleveland sits 1.68 percentage points easier than the next club. Only nine of 42 games are against teams at .500 or better, and none are against a .550 team in the snapshot. Six games each with Kansas City and Detroit plus three each with the Athletics, Rockies and Angels pull the average down. The Guardians still entered 58-62; schedule opportunity does not erase the four losses already below .500.
29. Seattle Mariners — .4758
Fourteen of Seattle's 42 remaining games come against the Athletics and Angels, both below .400 on August 12. Five more are against Houston. The tradeoff is location: Seattle has 19 at home and 23 away. Road volume is not reflected in .4758, so calling this the second-easiest “environment” would overstate what the number measures.
28. Houston Astros — .4818
Houston's 41-game path contains seven against the Athletics, five against Seattle and four against the White Sox. A 22-home, 19-road split adds a mild contextual positive that the formula itself ignores. With Houston 61-60 and Texas 60-60, schedule softness is relevant because a small standings swing can change the AL West lead.
27. Kansas City Royals — .4829
Kansas City has six meetings apiece with Cleveland and Toronto and four with the Athletics. Just one of its 41 remaining games is against a club above .550 in this snapshot: a single makeup or isolated game with the Dodgers. For a 49-71 team, however, an easy finish is better understood as a chance to evaluate and improve than as a credible shortcut into October.
26. Chicago White Sox — .4848
Chicago owns a perfectly even 22-home, 22-road split over 44 games, the joint-largest remaining total in the league. Seven with Detroit, six with Minnesota and four with Houston shape the slate. The White Sox entered 61-57 and thus combine a favorable schedule with a winning record—more actionable race context than the rank alone supplies.
The central caution across all five is the same: opponent winning percentages are snapshots. A below-.500 club can promote prospects, return injured players or simply play better for six weeks. “Easiest” means lowest weighted opponent record on August 12, not automatic wins.
Which 2026 playoff races get the biggest schedule swing
NL Central: both leaders face resistance
Milwaukee entered 74-46 and Chicago 70-50. Their SOS values—.5210 for the Brewers and .5269 for the Cubs—are both among MLB's five hardest, so Chicago does not gain a large opponent-quality edge by itself. The seven games they play each other are more important: every win simultaneously moves one club up and the other down. Cincinnati's .5477 road makes its climb from 57-61 much steeper.
NL East: seven Braves-Phillies games can override the averages
Atlanta led at 72-48, followed by Philadelphia at 64-57 and Miami at 61-59. The Braves' .5236 slate is harder than Philadelphia's .5184, but that half-point difference is modest beside the existing records. Their seven direct meetings can transform both the division margin and tiebreaker picture. Miami's .5196 schedule offers no obvious soft alternative.
AL East: challengers have the gentler paths
Tampa Bay's 73-46 record came with a .5009 remaining SOS. The Yankees, 67-52, face .4907 opponents and have 25 of 43 games at home; Boston, 64-55, faces .4942. That gives both pursuers a real contextual advantage, but not a projection that they will erase Tampa Bay's banked lead. Check the MLB playoff format before assuming a second-place finish means the same seed as a division title.
AL Central and AL West: easy schedules meet crowded standings
The White Sox entered atop the AL Central at 61-57 with a .4848 slate. Cleveland was 58-62 but had the league's easiest path at .4590; Detroit and Minnesota remained between them. In the AL West, Houston stood 61-60, Texas 60-60 and Seattle 56-64. Houston's .4818 and Seattle's .4758 look favorable, yet their five meetings turn part of that softness into a direct contest.
Schedule strength is most useful when compared inside the same race and alongside the existing gap. It can identify pressure points, not erase the standings. The site's 2026 playoff schedule and bracket shows why division position, Wild Card position and byes carry different rewards once the regular season ends.
What opponent winning percentage misses
Raw opponent winning percentage looks backward. It treats a club's first 120 games as its current talent estimate, even if deadline trades, injured-player returns or recent performance have changed the roster. Projection systems can replace raw record with an estimate of future quality, but that is a different model and will produce a different ranking.
- Home and road: the table displays the split, but a home game and road game carry the same opponent value.
- Pitching matchups: facing an ace is priced the same as facing the back of the rotation.
- Rest and travel: off days, time zones and consecutive-game stretches are excluded.
- Roster availability: injuries, call-ups and late-season rest cannot be known from team record.
- Ballpark and weather: venue scoring environment and postponement risk are not modeled.
- Opponent interaction: no opponent-of-opponent adjustment asks how the current record was built.
Direct games against a standings rival deserve special attention. They receive the same one-game opponent weight in SOS, yet the result creates a win for one side and a loss for the other. That “two-way” standings leverage is why seven Cubs-Brewers games may matter more than their small difference in average opponent percentage.
For the same reason, do not multiply remaining games by one minus SOS and call the result expected wins. That would assume the subject club is league average, ignore game location and roster talent, and treat every opponent percentage as a perfect forecast. The ranking answers who appears to face stronger opponents, not who will make the postseason.
How to use and update the snapshot
- Start with the race, not the league rank. Compare division or Wild Card rivals and note the standings gap they must overcome.
- Open the full MLB schedule. Separate direct rival games from unrelated series because direct results move both sides.
- Check the games today. A final result changes the winning percentage of that opponent and removes one game from the remaining set.
- Refresh every input together. Pull updated standings, remove completed games and include any rescheduled makeup game before recalculating.
- Keep the timestamp attached. A ranking without an “as of” date invites readers to treat stale values as current.
For a quick update, make one row per remaining game, not one row per unique opponent. Put the opponent's refreshed winning percentage beside each row, average the column and repeat for every club being compared. A spreadsheet pivot can count home and road dates separately without changing the basic SOS value.
The final scheduled day is September 27, when every remaining count should reach zero after results become final. Until then, the ranking should be expected to move. A club can rise in difficulty because its future opponents win, fall because they lose, or shift sharply when a strong or weak series leaves the remaining sample.
Remaining strength of schedule FAQ
Is a higher remaining SOS harder?
Yes, in this article. Higher means the game-weighted opponents had a higher winning percentage on August 12. Some sites reverse the display into an “ease” score, so always read the methodology.
Is this the same as playoff odds?
No. Playoff odds combine a team-strength model, future matchups, postseason rules and many simulated outcomes. This ranking describes opponents using their current records and makes no probability claim.
Why can the rankings change every day?
Completed games leave the sample, future opponents' records change, and the mix of games shrinks. A difficult series disappearing from a team's remaining slate can move its average even if every other opponent stays the same.
How are postponed games handled?
A postponed game remains relevant when MLB reschedules it inside the regular season. A proper update should use the latest schedule feed, not merely subtract yesterday's listed games, because makeup dates and doubleheaders can change.
Does an SOS near .500 mean the team will play .500 baseball?
No. It says the weighted opponents had collectively played near .500. The subject team's talent, venues, pitchers and performance still determine its results. Arizona's .4993 and San Diego's .4986 therefore describe opponent records, not projected finishes.
Loading comments...